1.调用包
import numpy as np
import scipy.signal as sg
2.示例
2.1 简单示例
import numpy as np
import scipy.signal as sg
import matplotlib.pyplot as plt

def get_maxima(values: np.ndarray):
    """极大值点"""
    max_index = sg.argrelmax(values)[0]
    return max_index, values[max_index]


def get_minima(values: np.ndarray):
    """极小值点"""
    min_index = sg.argrelmin(values)[0]  # 极小值的下标
    return min_index, values[min_index]  # 返回极小值


if __name__ == '__main__':
    data = np.array([2, 1.5, 1, 1.5, 2, 3, 2, 0, 2, 3, 0])
    print("极值点下标", "极值")
    print(get_minima(data))
    print(get_maxima(data))
    plt.figure()
    plt.plot(data,'b')
    x,y=get_minima(data)
    plt.scatter(x,y)#,sizes=x*25,marker='o',color='r'
    x, y =get_maxima(data)
    plt.scatter(x,y)#,sizes=x*25,marker='*',color='y'
    plt.show()

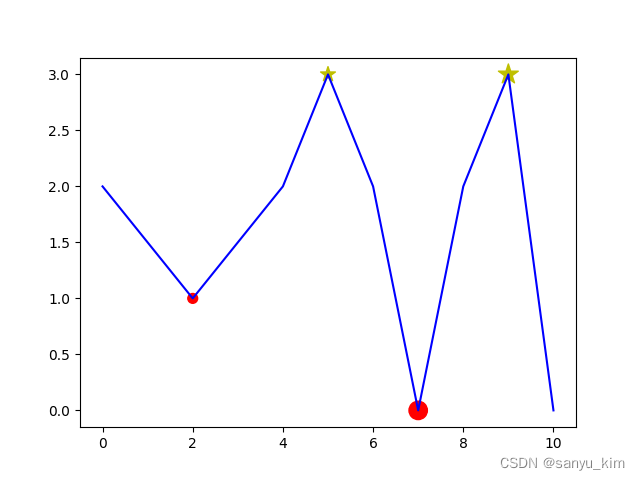
2.2 设置极值点颜色、形状、大小
import numpy as np
import scipy.signal as sg
import matplotlib.pyplot as plt

def get_maxima(values: np.ndarray):
    """极大值点"""
    max_index = sg.argrelmax(values)[0]
    return max_index, values[max_index]


def get_minima(values: np.ndarray):
    """极小值点"""
    min_index = sg.argrelmin(values)[0]  # 极小值的下标
    return min_index, values[min_index]  # 返回极小值


if __name__ == '__main__':
    data = np.array([2, 1.5, 1, 1.5, 2, 3, 2, 0, 2, 3, 0])
    print("极值点下标", "极值")
    print(get_minima(data))
    print(get_maxima(data))
    plt.figure()
    plt.plot(data,'b')
    x,y=get_minima(data)
    plt.scatter(x,y,sizes=x*25,marker='o',color='r')
    x, y =get_maxima(data)
    plt.scatter(x,y,sizes=x*25,marker='*',color='y')
    plt.show()