超级简单的数据自动滚动el-table表格
今天看到一个需求:
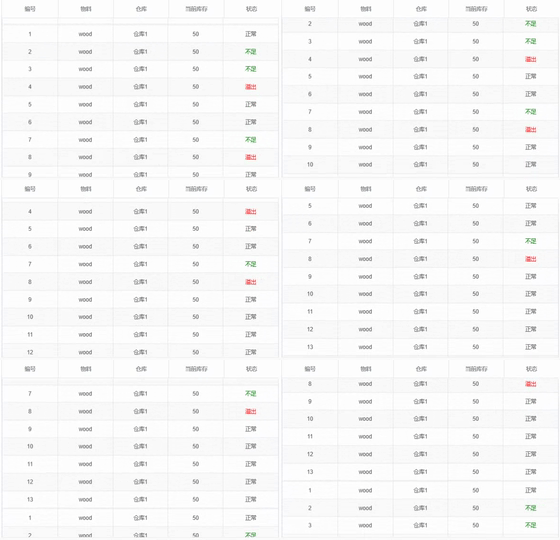
库存预警滚动表格,表格中每行数据由编号、物料及物料名称、仓库及仓库名称、当前库存及库存数量、状态(包括正常(黑色)、不足(绿色)、溢出(红色))构成,表格数据会自动滚动。
先来看一下成果:

直接上代码:
<template>
<div class="th">
<el-table class="th" border>
<!-- 手动固定一个表头 -->
<el-table-column label="编号" align="center" />
<el-table-column label="物料" align="center" />
<el-table-column label="仓库" align="center" />
<el-table-column label="当前库存" align="center" />
<el-table-column label="状态" align="center" />
</el-table>
<!--设置鼠标移入移出,悬浮时表格暂停动画-->
<div class="box" @mouseover="pauseAnimation" @mouseout="resumeAnimation">
<el-table
:data="data"
class="table"
border
stripe
:show-header="false"
>
<el-table-column align="center" label="" prop="id" />
<el-table-column align="center" label="" prop="matrial" />
<el-table-column align="center" label="" prop="store" />
<el-table-column align="center" label="" prop="stock" />
<el-table-column align="center" label="" prop="status">
<template slot-scope="scope">
<span :style="getStatusColor(scope.row.status)">{{ scope.row.status }}</span>
</template>
</el-table-column>
</el-table>
</div>
</div>
</template>
<script>
export default {
data() {
return {
data: [
{ id: 1, matrial: "wood", store: "仓库1", stock: 50, status: "正常" },
{ id: 2, matrial: "wood", store: "仓库1", stock: 50, status: "不足" },
{ id: 3, matrial: "wood", store: "仓库1", stock: 50, status: "不足" },
{ id: 4, matrial: "wood", store: "仓库1", stock: 50, status: "溢出" },
{ id: 5, matrial: "wood", store: "仓库1", stock: 50, status: "正常" },
{ id: 6, matrial: "wood", store: "仓库1", stock: 50, status: "正常" },
{ id: 7, matrial: "wood", store: "仓库1", stock: 50, status: "不足" },
{ id: 8, matrial: "wood", store: "仓库1", stock: 50, status: "溢出" },
{ id: 9, matrial: "wood", store: "仓库1", stock: 50, status: "正常" },
{ id: 10, matrial: "wood", store: "仓库1", stock: 50, status: "正常" },
{ id: 11, matrial: "wood", store: "仓库1", stock: 50, status: "正常" },
{ id: 12, matrial: "wood", store: "仓库1", stock: 50, status: "正常" },
{ id: 13, matrial: "wood", store: "仓库1", stock: 50, status: "正常" },
],
};
},
mounted(){
},
methods: {
getStatusColor(status) {
if (status === "正常") {
return { color: "" };
} else if (status === "不足") {
return { color: "green" };
} else if (status === "溢出") {
return { color: "red" };
}
},
pauseAnimation() {
const tables = document.querySelectorAll(".table");
tables.forEach((table) => {
table.style.animationPlayState = "paused";
});
},
resumeAnimation() {
const tables = document.querySelectorAll(".table");
tables.forEach((table) => {
table.style.animationPlayState = "running";
});
},
},
};
</script>
<style scoped>
.box {
width: 700px;
overflow: hidden;
border: 1px solid #eaeef2;
height: 400px;
}
.table {
width: 700px;
animation: table 10s infinite linear;
}
@keyframes table {
0% {
transform: translateY(0);
}
100% {
transform: translateY(-100%);
}
}
.th {
transform: translateY(60px);
width: 700px;
}
</style>
这样一个数据可视化的自动滚动表格就做好了,是不是很简单?