echarts环形图内接分类名称并且颜色名称颜色跟随变化
大家首先看一个echarts图,地址:圆环图自定义legend、设置默认选中 - category-work,legend,series-pie饼图,title标题 - makeapie echarts社区图表可视化案例
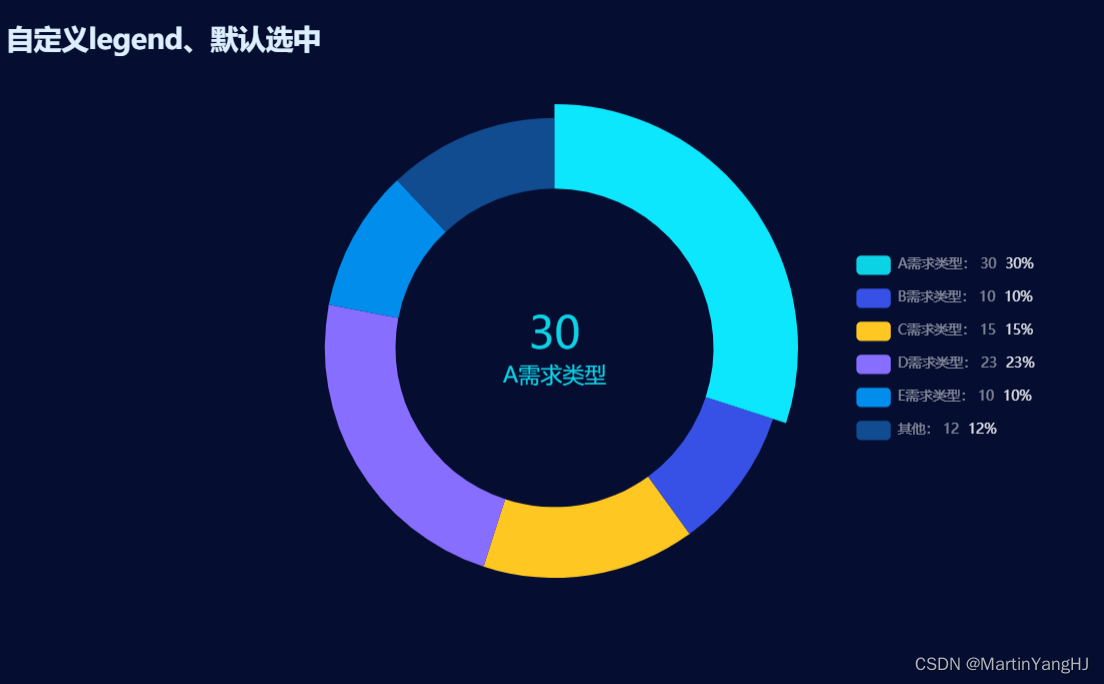
该图如下所示: 以上是采用echarts4.8.0绘制的,代码如下:
var color = [
    '#0CD2E6',
    '#3751E6',
    '#FFC722',
    '#886EFF',
    '#008DEC',
    '#114C90',
    '#00BFA5',
];

var title = '自定义legend、默认选中';
var legend = [
    'A需求类型',
    'B需求类型',
    'C需求类型',
    'D需求类型',
    'E需求类型',
    '其他'
];

var seriesData = [
    { "name": "A需求类型", "value": 30 },
    { "name": "B需求类型", "value": 10 },
    { "name": "C需求类型", "value": 15 },
    { "name": "D需求类型", "value": 23 },
    { "name": "E需求类型", "value": 10 },
    { "name": "其他", "value": 12 }
]

var option = {
    backgroundColor:'#050e31',
    color: color,
    title: {
        top: 20,
        text: title,
        textStyle: {
            fontSize: 20,
            color: '#DDEEFF',
        },
    },
    grid: {
        top: '15%',
        left: 0,
        right: '1%',
        bottom: 5,
        containLabel: true,
    },
    legend: {
        orient: 'vertical',
        top: 'center',
        right: 50,
        textStyle: {
            align: 'left',
            verticalAlign: 'middle',
            rich: {
                name: {
                    color: 'rgba(255,255,255,0.5)',
                    fontSize: 10,
                },
                value: {
                    color: 'rgba(255,255,255,0.5)',
                    fontSize: 10,
                },
                rate: {
                    color: 'rgba(255,255,255,0.9)',
                    fontSize: 10,
                },
            },
        },
        data: legend,
        formatter: (name) => {
            if (seriesData.length) {
                const item = seriesData.filter((item) => item.name === name)[0];
                return `{name|${name}:}{value| ${item.value}} {rate| ${item.value}%}`;
            }
        },
    },
    series: [{
        name: '需求类型占比',
        type: 'pie',
        center: ['50%', '50%'],
        radius: ['45%', '65%'],
        label: {
            normal: {
                show: false,
                position: 'center',
                formatter: '{value|{c}}\n{label|{b}}',
                rich: {
                    value: {
                        padding: 5,
                        align: 'center',
                        verticalAlign: 'middle',
                        fontSize: 32,
                    },
                    label: {
                        align: 'center',
                        verticalAlign: 'middle',
                        fontSize: 16,
                    },
                },
            },
            emphasis: {
                show: true,
                textStyle: {
                    fontSize: '12',
                },
            },
        },
        labelLine: {
            show: false,
            length: 0,
            length2: 0,
        },
        data: seriesData,
    }],
};

myChart.setOption(option);

getDefaultSelected(myChart)

function getDefaultSelected(myChart) {
    let index = 0;
    myChart.dispatchAction({
      type: 'highlight',
      seriesIndex: 0,
      dataIndex: 0,
    });
    myChart.on('mouseover', (e) => {
      if (e.dataIndex !== index) {
        myChart.dispatchAction({
          type: 'downplay',
          seriesIndex: 0,
          dataIndex: index,
        });
      }
    });
    myChart.on('mouseout', (e) => {
      index = e.dataIndex;
      myChart.dispatchAction({
        type: 'highlight',
        seriesIndex: 0,
        dataIndex: e.dataIndex,
      });
    });
}
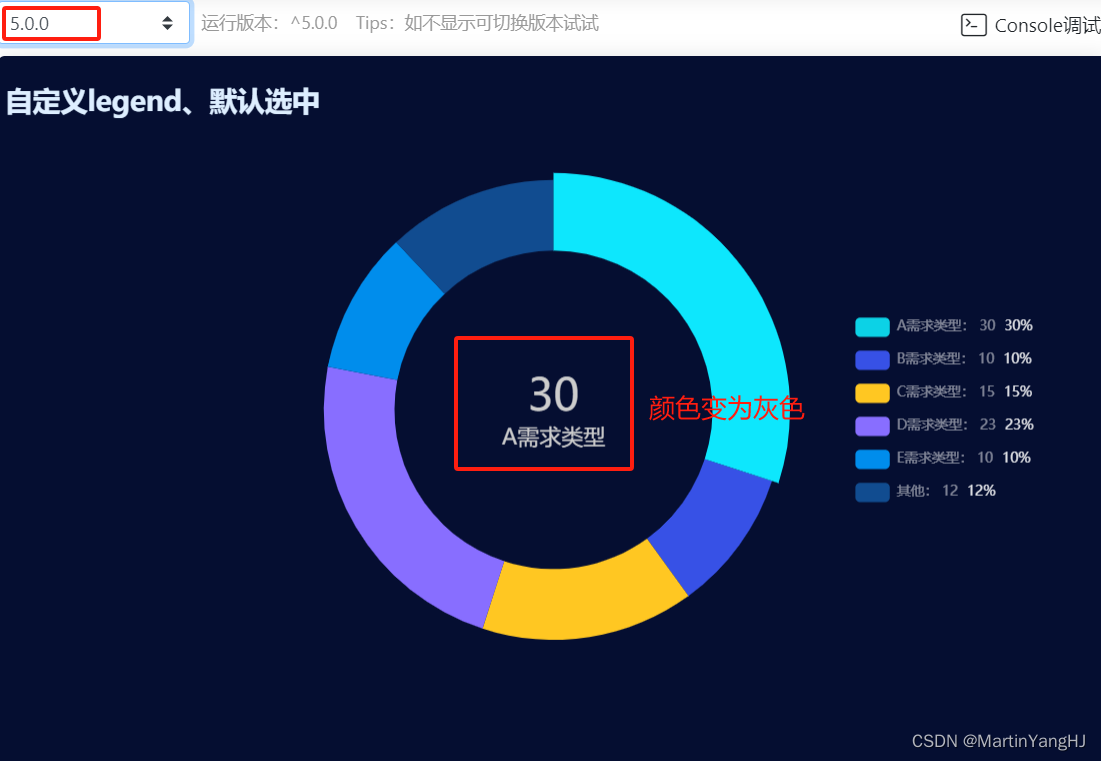
但是,如果升级echarts的版本到5.0.0或者以上,仍采用上述代码绘制,那么中间的文字将不再有颜色,如下:
怎样才能绘制4.8.0时的样式呢?
按照如下方式即可:
//将上述代码中的emphasis处的代码改为如下
emphasis: {
                show: true,
                textStyle: {
                    fontSize: '12',
                    //添加如下代码
                    color:function(params){
                    }
                },
            },