Python之2D绘图套件-Matplotlib详解
简介
Matplotlib 是一个 Python 的 2D绘图库,它以各种硬拷贝格式和跨平台的交互式环境生成出版质量级别的图形。通过 Matplotlib,开发者可以仅需要几行代码,便可以生成绘图,直方图,功率谱,条形图,错误图,散点图等。
机器学习实例
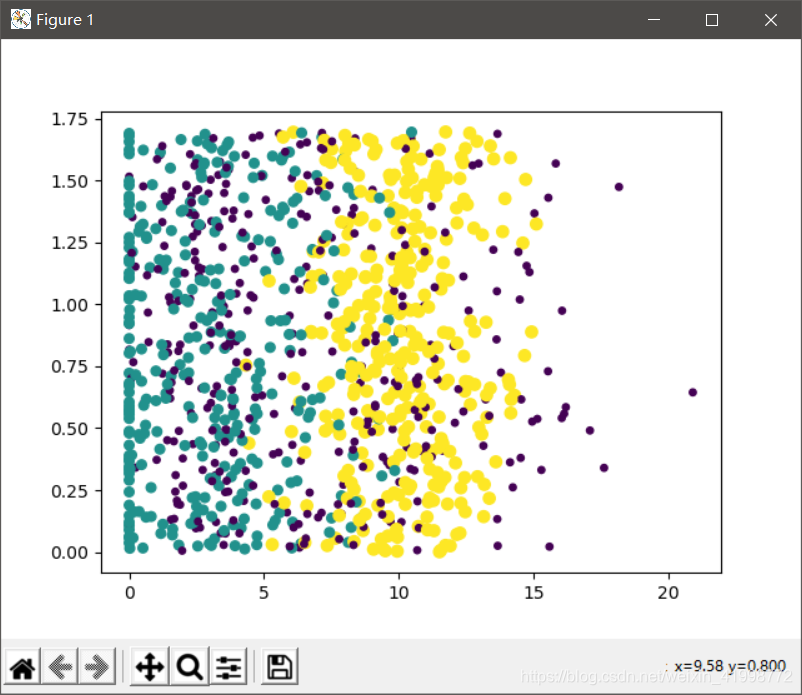
1、创建散点图
import matplotlib
import matplotlib.pyplot as plt
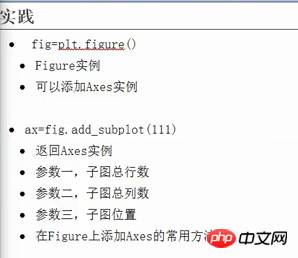
fig = plt.figure() #以Id为1创建一个窗口
ax = fig.add_subplot(111)
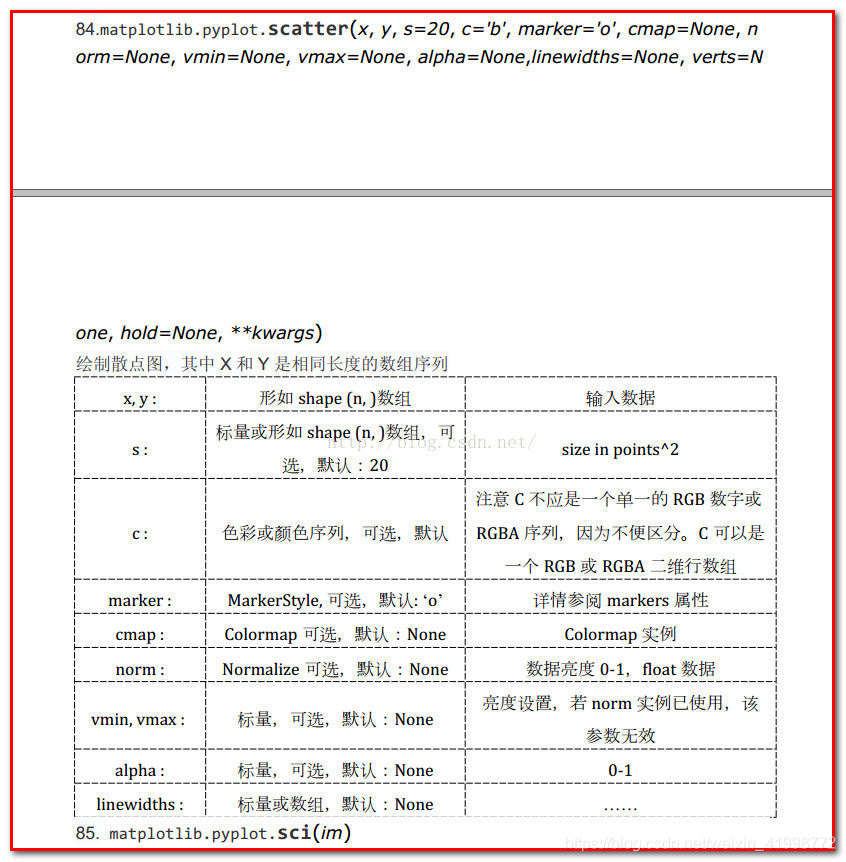
ax.scatter(datingDataMat[:,1],datingDataMat[:,2],15.0*array(datingLabels),15.0*array(datingLabels))#输入x、y、大小、颜色
plt.show()
- Matplotlib.pyplot 包含一系列类似 MATLAB 中绘图函数的相关函数。常以plt作为Matplotlib.pyplot的简写