代码
import matplotlib.pyplot as plt
import numpy as np
def get_data(txt_path: str = '', epoch: int = 100, target: str = '', target_data_len: int = 5):
num_list = []
data = open(txt_path, encoding="utf-8")
str1 = data.read()
data.close()
for i in range(0, epoch):
index = str1.find(target)
num_list.append(float(str1[index+len(target):index+len(target)+target_data_len]))
str1 = str1.replace(target, 'xxxx', 1)
return num_list
plt.rcParams['font.size'] = 18
list_ACC1 = get_data("./everything_to_Matlab/test.txt", 51, target="ACC1:", target_data_len=11)
list_ACC2 = get_data("./everything_to_Matlab/test.txt", 51, target="test2:", target_data_len=11)
list_loss1 = get_data("./everything_to_Matlab/test.txt", 50, target="loss1:", target_data_len=11)
list_loss2 = get_data("./everything_to_Matlab/test.txt", 50, target="loss2:", target_data_len=11)
fig, ax1 = plt.subplots()
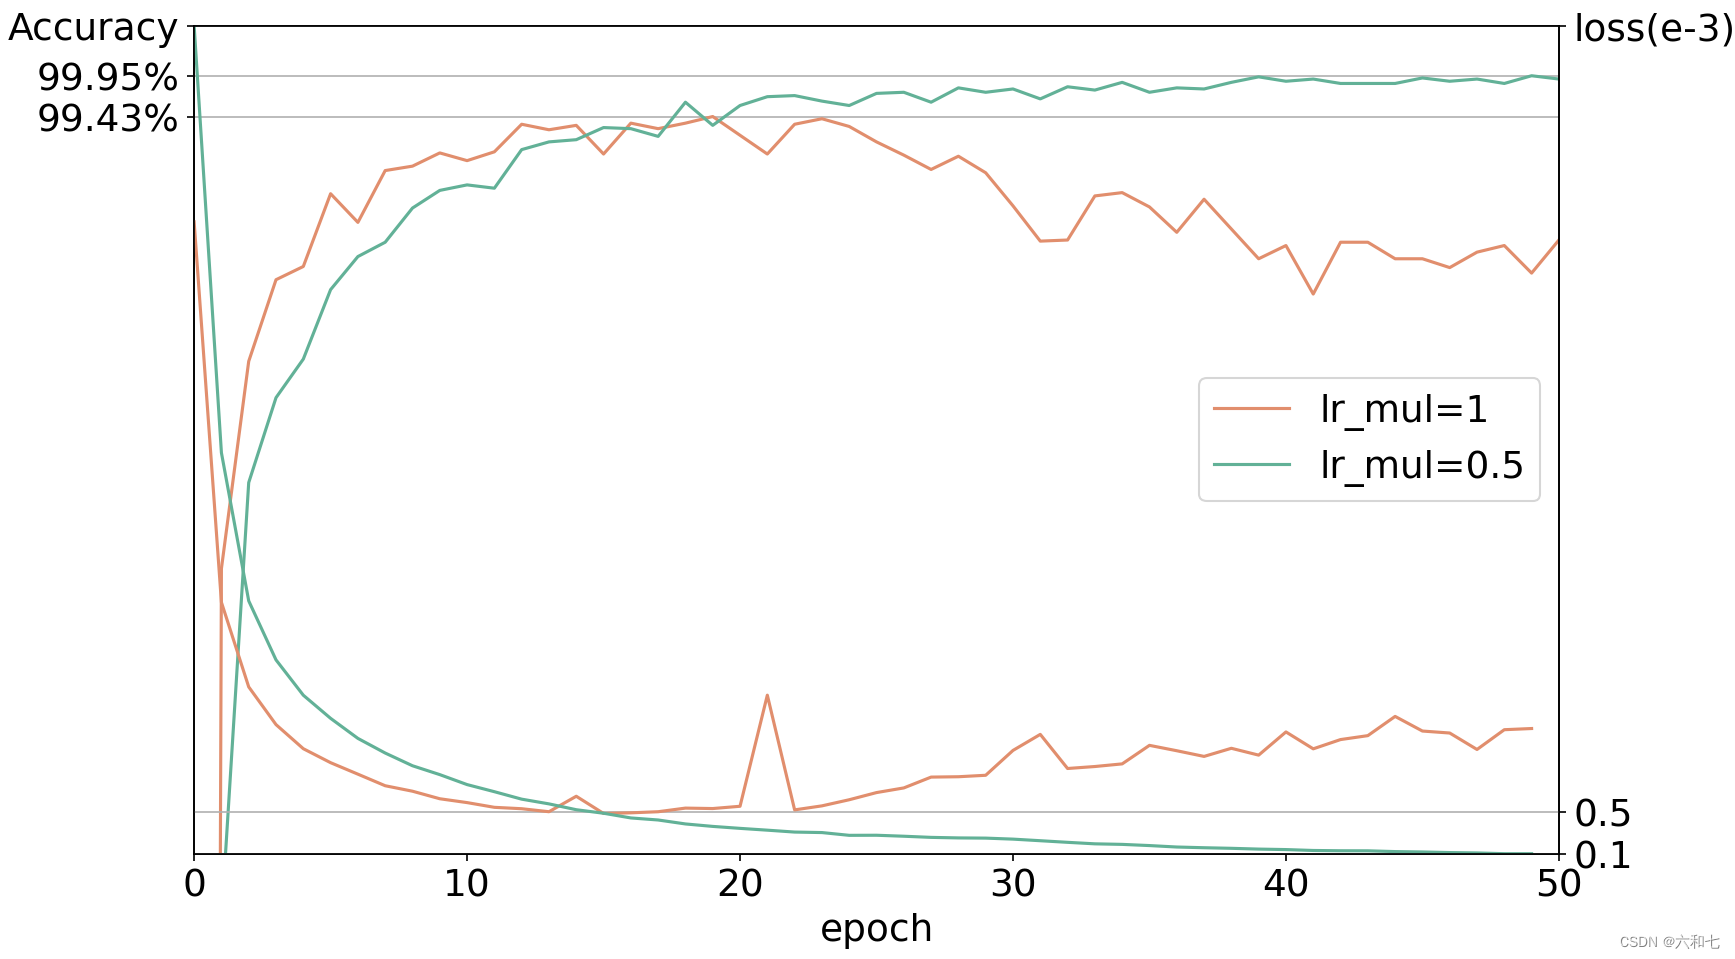
ax1.plot(list_ACC1, color = "#E18E6D", label = "lr_mul=1")
ax1.plot(list_ACC2, color = "#62B197", label = "lr_mul=0.5")
ax1.legend(loc='center right')
ax1.set_yticks([0.9995, 0.9943, 1.006])
ax1.set_yticklabels(["99.95%", "99.43%", "Accuracy"])
ax1.set_ylim(0.90, 1.006)
ax1.set_xlim(0, 50)
ax1.set_xlabel("epoch")
ax1.grid(axis='y')
ax2 = ax1.twinx()
ax2.plot(list_loss1, color = "#E18E6D")
ax2.plot(list_loss2, color = "#62B197")
ax2.set_yticks([0.0005025579, 0.0001039364, 0.0079685581])
ax2.set_yticklabels(["0.5", "0.1", "loss(e-3)"])
ax2.set_ylim(0.0001039364 , 0.0079685581)
ax2.set_xlim(0, 50)
ax2.set_xlabel("epoch")
ax2.grid(axis='y')
plt.show()
结果