ECharts配置个性化图表:圆环、立体柱状图
ECharts配置个性化图表:圆环、立体柱状图
官网调试地址:点击跳转调试
圆环图
效果图:
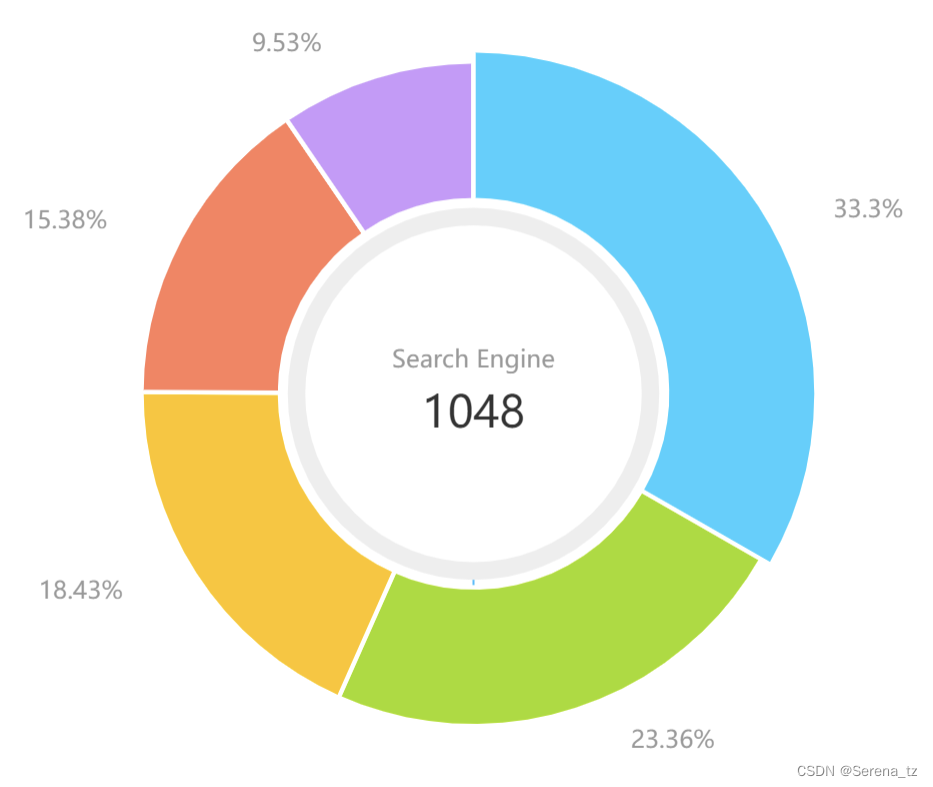
配置:
option = {
  color: ['#29BEFF', '#A2DC00', '#FFC400', '#FF7F5C', '#CA99FC'],
  // 提示窗
  tooltip: {
    trigger: 'item',
    show: false
  },
  // 图例
  legend: {
    top: '5%',
    left: 'center',
    show: false
  },
  // 数据
  series: [
    {
      name: 'Access From',
      type: 'pie',
      radius: ['35%', '60%'], //可以设置圆环的宽度
      avoidLabelOverlap: false,
      itemStyle: {
        borderColor: '#fff',
        borderWidth: 2
      },
      label: {
        show: true,
        formatter: '{d}%',
        position: 'outside',
        fontSize: 11,
        color: '#999'
      },
      emphasis: {
        label: {
          show: false,
          formatter: ['{a|{b}}', '{b|{c}}'].join('\n'),
          rich: {
            a: {
              fontFamily: 'PingFangSC-Regular',
              fontSize: 11,
              color: '#999',
              textAlign: 'center',
              lineHeight: 20,
              fontWeight: 400
            },
            b: {
              fontFamily: 'PingFangSC-Medium',
              fontSize: 20,
              color: '#333',
              letterSpacing: 0,
              textAlign: 'center',
              lineHeight: 30,
              fontWeight: 500
            },
            x: {
              fontSize: 18,
              fontFamily: 'Microsoft YaHei',
              borderColor: '#449933',
              borderRadius: 4
            }
          }
        }
      },
      labelLine: {
        show: false
      },
      data: [
        { value: 1048, name: 'Search Engine' },
        { value: 735, name: 'Direct' },
        { value: 580, name: 'Email' },
        { value: 484, name: 'Union Ads' },
        { value: 300, name: 'Video Ads' }
      ]
    },
    {
      name: '外边框',
      type: 'pie',
      clockWise: false,
      radius: ['32%', '32%'], //边框大小
      center: ['50%', '50%'], //边框位置
      data: [
        {
          value: 10,
          itemStyle: {
            normal: {
              borderWidth: 8, //设置边框粗细
              borderColor: '#eee' //边框颜色
            }
          }
        }
      ]
    },
    {
      //显示中间的数据
      name: 'Access From',
      type: 'pie',
      radius: ['35%', '60%'], //可以设置圆环的宽度
      avoidLabelOverlap: false,
      itemStyle: {
        borderColor: '#fff',
        borderWidth: 2
      },
      label: {
        show: false,
        formatter: '{d}%',
        position: 'center',
        fontSize: 11,
        color: '#999'
      },
      emphasis: {
        label: {
          show: true,
          formatter: ['{a|{b}}', '{b|{c}}'].join('\n'),
          rich: {
            a: {
              fontFamily: 'PingFangSC-Regular',
              fontSize: 11,
              color: '#999',
              textAlign: 'center',
              lineHeight: 20,
              fontWeight: 400
            },
            b: {
              fontFamily: 'PingFangSC-Medium',
              fontSize: 20,
              color: '#333',
              letterSpacing: 0,
              textAlign: 'center',
              lineHeight: 30,
              fontWeight: 500
            },
            x: {
              fontSize: 18,
              fontFamily: 'Microsoft YaHei',
              borderColor: '#449933',
              borderRadius: 4
            }
          }
        }
      },
      labelLine: {
        show: false
      },
      data: [
        { value: 1048, name: 'Search Engine' },
        { value: 735, name: 'Direct' },
        { value: 580, name: 'Email' },
        { value: 484, name: 'Union Ads' },
        { value: 300, name: 'Video Ads' }
      ]
    }
  ]
};
双纵轴多数据面积图
效果图:

代码:
option = {
  // 提示窗
  tooltip: {
    trigger: 'axis',
    axisPointer: {
      type: 'shadow'
    }
  },
  legend: {
    data: ['发电量', '供电气耗']
  },
  xAxis: {
    type: 'category',
    axisTick: {
      show: false //x轴刻度尺
    },
    axisLine: {
      show: false, //x轴刻度尺
      //x轴线条颜色
      lineStyle: {
        color: '#999'
      }
    },
    data: ['Mon', 'Tue', 'Wed', 'Thu', 'Fri', 'Sat', 'Sun']
  },
  yAxis: [
    {
      type: 'value',
      name: '万kwh',
      position: 'left',
      splitLine: {
        lineStyle: {
          color: '#EFEFEF' //网格线颜色
        }
      },
      axisLine: {
        show: false //y轴线条
      }
    },
    {
      type: 'value',
      name: 'Nm3/kwh',
      position: 'right',
      splitLine: {
        lineStyle: {
          color: '#EFEFEF' //网格线颜色
        }
      },
      axisLine: {
        show: false //y轴线条
      }
    }
  ],
  series: [
    {
      type: 'line',
      name: '发电量',
      data: [820, 932, 901, 934, 524, 754, 142],
      smooth: true, //面积图改成弧形状
      lineStyle: {
        width: 1, //外边线宽度
        color: '#377AFA' //外边线颜色
      },
      showSymbol: false, //去除面积图节点圆
      areaStyle: {
        //区域填充渐变颜色
        color: {
          type: 'linear',
          x: 0,
          y: 0,
          x2: 0,
          y2: 1,
          colorStops: [
            {
              offset: 0,
              color: 'rgba(91,143,249,0.20)' // 0% 处的颜色
            },
            {
              offset: 1,
              color: 'rgba(91,143,249,0.00)' // 100% 处的颜色
            }
          ],
          global: false // 缺省为 false
        }
      }
    },
    {
      name: '供电气耗',
      type: 'line',
      yAxisIndex: 1,
      data: [154, 565, 756, 934, 248, 788, 1320],
      smooth: true, //面积图改成弧形状
      lineStyle: {
        width: 1, //外边线宽度
        color: '#35C724' //外边线颜色
      },
      showSymbol: false, //去除面积图节点圆
      areaStyle: {
        //区域填充渐变颜色
        color: {
          type: 'linear',
          x: 0,
          y: 0,
          x2: 0,
          y2: 1,
          colorStops: [
            {
              offset: 0,
              color: 'rgba(221,243,215, 0.5)' // 0% 处的颜色
            },
            {
              offset: 1,
              color: 'rgba(250,252,252, 1)' // 100% 处的颜色
            }
          ],
          global: false // 缺省为 false
        }
      }
    }
  ]
};
折柱混合图
效果图:

代码:
option = {
  color: ['#2078F7 ', '#04C591 ', '#FFB202 '],
  tooltip: {
    trigger: 'axis',
    axisPointer: {
      type: 'cross',
      crossStyle: {
        color: '#999'
      }
    }
  },
  legend: {
    left: 'right',
    data: ['计划电量', '实际电量', '出清电价']
  },
  xAxis: [
    {
      type: 'category',
      axisTick: {
        show: false //x轴刻度尺
      },
      axisLine: {
        show: false, //x轴刻度尺
        //x轴线条颜色
        lineStyle: {
          color: '#999'
        }
      },
      data: ['Mon', 'Tue', 'Wed', 'Thu', 'Fri', 'Sat', 'Sun'],
      axisPointer: {
        type: 'shadow'
      }
    }
  ],
  yAxis: [
    {
      type: 'value',
      name: 'MW',
      axisLabel: {
        formatter: '{value}'
      },
      splitLine: {
        lineStyle: {
          color: '#EFEFEF' //网格线颜色
        }
      },
      axisLine: {
        show: false //y轴线条
      }
    },
    {
      type: 'value',
      name: '元',
      axisLabel: {
        formatter: '{value}'
      },
      splitLine: {
        show: false,
        lineStyle: {
          color: '#EFEFEF' //网格线颜色
        }
      },
      axisLine: {
        show: false //y轴线条
      }
    }
  ],
  series: [
    {
      name: '计划电量',
      type: 'bar',
      barWidth: 8, // 设置柱状图的宽度
      itemStyle: {
        borderRadius: [5, 5, 5, 5] // 分别表示左上、右上、右下、左下四个角的半径大小
      },
      tooltip: {
        valueFormatter: function (value) {
          return value + ' ml';
        }
      },
      data: [
        2.0, 4.9, 7.0, 23.2, 25.6, 76.7, 135.6, 162.2, 32.6, 20.0, 6.4, 3.3
      ]
    },
    {
      name: '实际电量',
      type: 'bar',
      barWidth: 8, // 设置柱状图的宽度
      itemStyle: {
        borderRadius: [5, 5, 5, 5] // 分别表示左上、右上、右下、左下四个角的半径大小
      },
      tooltip: {
        valueFormatter: function (value) {
          return value + ' ml';
        }
      },
      data: [
        2.6, 5.9, 9.0, 26.4, 28.7, 70.7, 175.6, 182.2, 48.7, 18.8, 6.0, 2.3
      ]
    },
    {
      name: '出清电价',
      type: 'line',
      yAxisIndex: 1,

      tooltip: {
        valueFormatter: function (value) {
          return value + ' °C';
        }
      },
      data: [2.0, 2.2, 3.3, 4.5, 6.3, 10.2, 20.3, 23.4, 23.0, 16.5, 12.0, 6.2]
    }
  ]
};
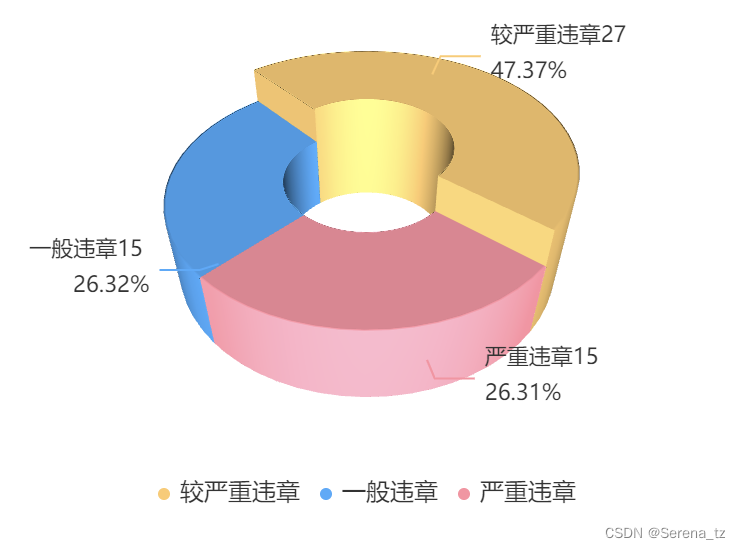
3D立体圆环饼图
效果图:
代码:
<!DOCTYPE html>
<html lang="en">

<head>
    <meta charset="UTF-8">
    <meta http-equiv="X-UA-Compatible" content="IE=edge">
    <meta name="viewport" content="width=device-width, initial-scale=1.0">
    <title>Document</title>
    <script src="https://cdn.bootcdn.net/ajax/libs/echarts/5.4.1/echarts.min.js"></script>
    <script src="https://cdn.bootcdn.net/ajax/libs/echarts-gl/2.0.8/echarts-gl.js"></script>
</head>

<body>
    <div id="echarts-bt" style="width: 375px; height: 300px;"></div>
</body>

<script>
    init();
    //3D饼图 - 1
    function init() {
        //初始化,根据自己项目进行初始化
        var chartDom = document.getElementById('echarts-bt');
        var myChart = echarts.init(chartDom);

        let boxHeight
        let legendData = [];
        let legendBfb = [];

        function getParametricEquation(startRatio, endRatio, isSelected, isHovered, k, h) {
            // 计算
            let midRatio = (startRatio + endRatio) / 2;
            let startRadian = startRatio * Math.PI * 2;
            let endRadian = endRatio * Math.PI * 2;
            let midRadian = midRatio * Math.PI * 2;
            // 如果只有一个扇形,则不实现选中效果。
            if (startRatio === 0 && endRatio === 1) {
                isSelected = false;
            }
            // 通过扇形内径/外径的值,换算出辅助参数 k(默认值 1/3)
            k = typeof k !== 'undefined' ? k : 1 / 3;
            // 计算选中效果分别在 x 轴、y 轴方向上的位移(未选中,则位移均为 0)
            let offsetX = isSelected ? Math.cos(midRadian) * 0.1 : 0;
            let offsetY = isSelected ? Math.sin(midRadian) * 0.1 : 0;
            // 计算高亮效果的放大比例(未高亮,则比例为 1)
            let hoverRate = isHovered ? 1.05 : 1;
            // 返回曲面参数方程
            return {
                u: {
                    min: -Math.PI,
                    max: Math.PI * 3,
                    step: Math.PI / 32
                },
                v: {
                    min: 0,
                    max: Math.PI * 2,
                    step: Math.PI / 20
                },
                x: function (u, v) {
                    if (u < startRadian) {
                        return offsetX + Math.cos(startRadian) * (1 + Math.cos(v) * k) * hoverRate;
                    }
                    if (u > endRadian) {
                        return offsetX + Math.cos(endRadian) * (1 + Math.cos(v) * k) * hoverRate;
                    }
                    return offsetX + Math.cos(u) * (1 + Math.cos(v) * k) * hoverRate;
                },
                y: function (u, v) {
                    if (u < startRadian) {
                        return offsetY + Math.sin(startRadian) * (1 + Math.cos(v) * k) * hoverRate;
                    }
                    if (u > endRadian) {
                        return offsetY + Math.sin(endRadian) * (1 + Math.cos(v) * k) * hoverRate;
                    }
                    return offsetY + Math.sin(u) * (1 + Math.cos(v) * k) * hoverRate;
                },
                z: function (u, v) {
                    if (u < -Math.PI * 0.5) {
                        return Math.sin(u);
                    }
                    if (u > Math.PI * 2.5) {
                        return Math.sin(u) * h * .1;
                    }
                    return Math.sin(v) > 0 ? 1 * h * .1 : -1;
                }
            };
        }

        // 生成模拟 3D 饼图的配置项
        function getPie3D(pieData, internalDiameterRatio) {
            //internalDiameterRatio:透明的空心占比
            let series = [];
            let sumValue = 0;
            let startValue = 0;
            let endValue = 0;

            let k = 1 - internalDiameterRatio;
            pieData.sort((a, b) => {
                return (b.value - a.value);
            });
            // 为每一个饼图数据,生成一个 series-surface 配置
            for (let i = 0; i < pieData.length; i++) {
                sumValue += pieData[i].value;
                let seriesItem = {
                    name: typeof pieData[i].name === 'undefined' ? `series${i}` : pieData[i].name,
                    type: 'surface',
                    parametric: true,
                    wireframe: {
                        show: false
                    },
                    pieData: pieData[i],
                    pieStatus: {
                        selected: false,
                        hovered: false,
                        k: k
                    },
                    center: ['10%', '50%'],
                };

                if (typeof pieData[i].itemStyle != 'undefined') {
                    let itemStyle = {};
                    typeof pieData[i].itemStyle.color != 'undefined' ? itemStyle.color = pieData[i].itemStyle.color : null;
                    typeof pieData[i].itemStyle.opacity != 'undefined' ? itemStyle.opacity = pieData[i].itemStyle.opacity : null;
                    seriesItem.itemStyle = itemStyle;
                }
                series.push(seriesItem);
            }

            // 使用上一次遍历时,计算出的数据和 sumValue,调用 getParametricEquation 函数,
            // 向每个 series-surface 传入不同的参数方程 series-surface.parametricEquation,也就是实现每一个扇形。
            legendData = [];
            legendBfb = [];
            for (let i = 0; i < series.length; i++) {
                endValue = startValue + series[i].pieData.value;
                series[i].pieData.startRatio = startValue / sumValue;
                series[i].pieData.endRatio = endValue / sumValue;
                series[i].parametricEquation = getParametricEquation(
                    series[i].pieData.startRatio,
                    series[i].pieData.endRatio,
                    false,
                    false,
                    k,
                    series[i].pieData.value    // 控制各模块高度一致100   控制各模块高度根据value改变
                );
                startValue = endValue;
                const bfb = fomatFloat(series[i].pieData.value / sumValue, 4)
                legendData.push({
                    name: series[i].name,
                    value: bfb
                });
                legendBfb.push({
                    name: series[i].name,
                    value: bfb
                });
            }
            boxHeight = getHeight3D(series, 26);//通过传参设定3d饼/环的高度,26代表26px
            return series

        }

        function fomatFloat(num, n) {
            var f = parseFloat(num);
            if (isNaN(f)) {
                return false;
            }
            f = Math.round(num * Math.pow(10, n)) / Math.pow(10, n);
            var s = f.toString();
            var rs = s.indexOf('.');

            //判定如果是整数,增加小数点再补0
            if (rs < 0) {
                rs = s.length;
                s += '.';
            }
            while (s.length <= rs + n) {
                s += '0';
            }

            return s;
        }

        //获取3d饼图的最高扇区的高度
        function getHeight3D(series, height) {
            series.sort((a, b) => {
                return (b.pieData.value - a.pieData.value);
            })
            return height * 25 / series[0].pieData.value;
        }


        let optionData = [{
            name: '一般违章',
            value: 15,
            itemStyle: {
                color: '#42ABFD',
            }
        }, {
            name: '较严重违章',
            value: 27,
            itemStyle: {
                color: '#FFC96B'
            }
        }, {
            name: '严重违章',
            value: 15,
            itemStyle: {
                color: '#FF90A1'
            }
        }]
        const series = getPie3D(optionData, 0.59);

        //重新绘一个2D的饼图显示连接线及数据
        series.push({
            name: 'pie2d',
            type: 'pie',
            label: {
                opacity: 1,
                fontSize: 13,
                lineHeight: 20,
            },
            labelLine: {
                length: 10,
                length2: 20
            },
            startAngle: -20, //起始角度,支持范围[0, 360]。
            clockwise: false,//饼图的扇区是否是顺时针排布。上述这两项配置主要是为了对齐3d的样式
            radius: ['10%', '52%'],
            data: optionData,
            itemStyle: {
                opacity: 0
            }
        });

        optionData.forEach((item, index) => {
            item.label = {
                color: '#333',
                show: true,
                formatter: '{b|{b}{c} \n}{c|{d}%}',
                rich: {
                    b: {
                        fontSize: 11,
                        lineHeight: 16
                    },
                    c: {
                        fontSize: 11,
                    },
                },
            };
        })

        // 准备待返回的配置项,把准备好的 legendData、series 传入。
        let option = {
            backgroundColor: '#fff',
            legend: {
                data: legendData,
                bottom: 0,
                itemWidth: 6,
                textStyle: {
                    color: '#333',
                },
                show: true,
                icon: "circle",
            },
            xAxis3D: {
                min: -1,
                max: 1
            },
            yAxis3D: {
                min: -1,
                max: 1
            },
            zAxis3D: {
                min: -1,
                max: 1
            },
            grid3D: {
                show: false,
                boxHeight: boxHeight, //圆环的高度
                viewControl: { //3d效果可以放大、旋转等,请自己去查看官方配置
                    alpha: 40, //角度
                    distance: 240,//调整视角到主体的距离,类似调整zoom
                    rotateSensitivity: 0, //设置为0无法旋转
                    zoomSensitivity: 0, //设置为0无法缩放
                    panSensitivity: 0, //设置为0无法平移
                    autoRotate: false //自动旋转
                }
            },
            series: series
        };
        myChart.setOption(option, true);
    }
</script>

</html>
3D立体饼图
效果图:

代码:
<!DOCTYPE html>
<html lang="en">

<head>
    <meta charset="UTF-8">
    <meta http-equiv="X-UA-Compatible" content="IE=edge">
    <meta name="viewport" content="width=device-width, initial-scale=1.0">
    <title>Document</title>
    <script src="https://cdn.bootcdn.net/ajax/libs/echarts/5.4.1/echarts.min.js"></script>
    <script src="https://cdn.bootcdn.net/ajax/libs/echarts-gl/2.0.8/echarts-gl.js"></script>
</head>

<body>
    <div id="echarts-bt" style="width: 375px; height: 300px;"></div>
</body>

<script>
    let optionData = [{
        name: '一般违章',
        value: 15,
        itemStyle: {
            color: '#42ABFD',
        }
    }, {
        name: '较严重违章',
        value: 27,
        itemStyle: {
            color: '#FFC96B'
        }
    }, {
        name: '严重违章',
        value: 15,
        itemStyle: {
            color: '#FF90A1'
        }
    }]
    mastery(optionData);

    //3D饼图 - 1
    function mastery(data) {
        var myChart = echarts.init(document.getElementById('echarts-bt'));
        var color = ["#42ABFD", "#FFC96B", "#FF90A1"]
        var data = data
        data.forEach((item, index) => {
            item.itemStyle = {
                color: color[index],
                opacity: 1,
            }
        })

        function getParametricEquation(startRatio, endRatio, isSelected, isHovered, k, h) {
            // 计算
            let midRatio = (startRatio + endRatio) / 2;

            let startRadian = startRatio * Math.PI * 2;
            let endRadian = endRatio * Math.PI * 2;
            let midRadian = midRatio * Math.PI * 2;

            // 如果只有一个扇形,则不实现选中效果。
            if (startRatio === 0 && endRatio === 1) {
                isSelected = false;
            }

            // 通过扇形内径/外径的值,换算出辅助参数 k(默认值 1/3)
            k = 1

            // 计算选中效果分别在 x 轴、y 轴方向上的位移(未选中,则位移均为 0)
            let offsetX = isSelected ? Math.cos(midRadian) * 0.1 : 0;
            let offsetY = isSelected ? Math.sin(midRadian) * 0.1 : 0;

            // 计算高亮效果的放大比例(未高亮,则比例为 1)
            let hoverRate = isHovered ? 1.05 : 1;

            // 返回曲面参数方程
            return {
                u: {
                    min: -Math.PI,
                    max: Math.PI * 3,
                    step: Math.PI / 32,
                },

                v: {
                    min: 0,
                    max: Math.PI * 2,
                    step: Math.PI / 20,
                },

                x: function (u, v) {
                    if (u < startRadian) {
                        return offsetX + Math.cos(startRadian) * (1 + Math.cos(v) * k) * hoverRate;
                    }
                    if (u > endRadian) {
                        return offsetX + Math.cos(endRadian) * (1 + Math.cos(v) * k) * hoverRate;
                    }
                    return offsetX + Math.cos(u) * (1 + Math.cos(v) * k) * hoverRate;
                },

                y: function (u, v) {
                    if (u < startRadian) {
                        return offsetY + Math.sin(startRadian) * (1 + Math.cos(v) * k) * hoverRate;
                    }
                    if (u > endRadian) {
                        return offsetY + Math.sin(endRadian) * (1 + Math.cos(v) * k) * hoverRate;
                    }
                    return offsetY + Math.sin(u) * (1 + Math.cos(v) * k) * hoverRate;
                },

                z: function (u, v) {
                    if (u < -Math.PI * 0.5) {
                        return Math.sin(u);
                    }
                    if (u > Math.PI * 2.5) {
                        return Math.sin(u) * h * 0.1;
                    }
                    return Math.sin(v) > 0 ? 1 * h * 0.1 : -1;
                },
            };
        }

        function getPie3D(pieData, internalDiameterRatio) {
            let series = [];
            let sumValue = 0;
            let startValue = 0;
            let endValue = 0;
            let legendData = [];
            let k = typeof internalDiameterRatio !== 'undefined' ? (1 - internalDiameterRatio) / (1 +
                internalDiameterRatio) : 1 /
            3;

            // 为每一个饼图数据,生成一个 series-surface 配置
            for (let i = 0; i < pieData.length; i++) {
                sumValue += pieData[i].value;

                let seriesItem = {
                    name: typeof pieData[i].name === 'undefined' ? `series${i}` : pieData[i].name,
                    value: typeof pieData[i].value === 'undefined' ? `series${i}` : pieData[i].value,
                    type: 'surface',
                    parametric: true,
                    wireframe: {
                        show: false,
                    },
                    pieData: pieData[i],
                    pieStatus: {
                        selected: false,
                        hovered: false,
                        k: k,
                    },
                };

                if (typeof pieData[i].itemStyle != 'undefined') {
                    let itemStyle = {};

                    typeof pieData[i].itemStyle.color != 'undefined' ? (itemStyle.color = pieData[i].itemStyle.color) :
                        null;
                    typeof pieData[i].itemStyle.opacity != 'undefined' ? (itemStyle.opacity = pieData[i].itemStyle
                        .opacity) : null;

                    seriesItem.itemStyle = itemStyle;
                }
                series.push(seriesItem);
            }
            // 使用上一次遍历时,计算出的数据和 sumValue,调用 getParametricEquation 函数,
            // 向每个 series-surface 传入不同的参数方程 series-surface.parametricEquation,也就是实现每一个扇形。
            for (let i = 0; i < series.length; i++) {
                endValue = startValue + series[i].pieData.value;
                series[i].pieData.startRatio = startValue / sumValue;
                series[i].pieData.endRatio = endValue / sumValue;
                series[i].parametricEquation = getParametricEquation(
                    series[i].pieData.startRatio,
                    series[i].pieData.endRatio,
                    false,
                    false,
                    k,
                    series[i].pieData.value
                );

                startValue = endValue;
                legendData.push(series[i].name);
            }

            // 补充一个透明的圆环,用于支撑高亮功能的近似实现。
            series.push({
                name: 'mouseoutSeries',
                type: 'surface',
                parametric: true,
                wireframe: {
                    show: false,
                },
                itemStyle: {
                    opacity: 0,
                },
                parametricEquation: {
                    u: {
                        min: 0,
                        max: Math.PI * 2,
                        step: Math.PI / 20,
                    },
                    v: {
                        min: 0,
                        max: Math.PI,
                        step: Math.PI / 20,
                    },
                    x: function (u, v) {
                        return Math.sin(v) * Math.sin(u) + Math.sin(u);
                    },
                    y: function (u, v) {
                        return Math.sin(v) * Math.cos(u) + Math.cos(u);
                    },
                    z: function (u, v) {
                        return Math.cos(v) > 0 ? 0.1 : -0.1;
                    },
                },
            }, {
                name: 'pie2d',
                type: 'pie',
                labelLine: {
                    length: 20,
                    length2: 30,
                },
                startAngle: -30, //起始角度,支持范围[0, 360]。
                clockwise: false, //饼图的扇区是否是顺时针排布。上述这两项配置主要是为了对齐3d的样式
                radius: ['40%', '40%'],
                center: ['50%', '50%'], //指示线的位置
                data: data,
                itemStyle: {
                    opacity: 0,
                },
            });

            // 准备待返回的配置项,把准备好的 legendData、series 传入。
            let option = {
                label: {
                    color: '#333',
                    show: true,
                    formatter: '{b|{b}{c} \n}{c|{d}%}',
                    rich: {
                        b: {
                            fontSize: 11,
                            lineHeight: 16
                        },
                        c: {
                            fontSize: 11,
                        },
                    },

                },
                xAxis3D: {
                    min: -1,
                    max: 1,
                },
                yAxis3D: {
                    min: -1,
                    max: 1,
                },
                zAxis3D: {
                    min: -1,
                    max: 1,
                },
                grid3D: {
                    show: false,
                    boxHeight: 30,
                    viewControl: {
                        //3d效果可以放大、旋转等,请自己去查看官方配置
                        alpha: 40,
                        beta: 40,
                        distance: 500,
                        rotateSensitivity: 0,
                        zoomSensitivity: 0,
                        panSensitivity: 0,
                        autoRotate: false,
                    }
                },
                series: series,
            };
            return option;
        }

        option = getPie3D(data, 0.71);
        if (option && typeof option === 'object') {
            myChart.setOption(option)
        }
    }
</script>

</html>
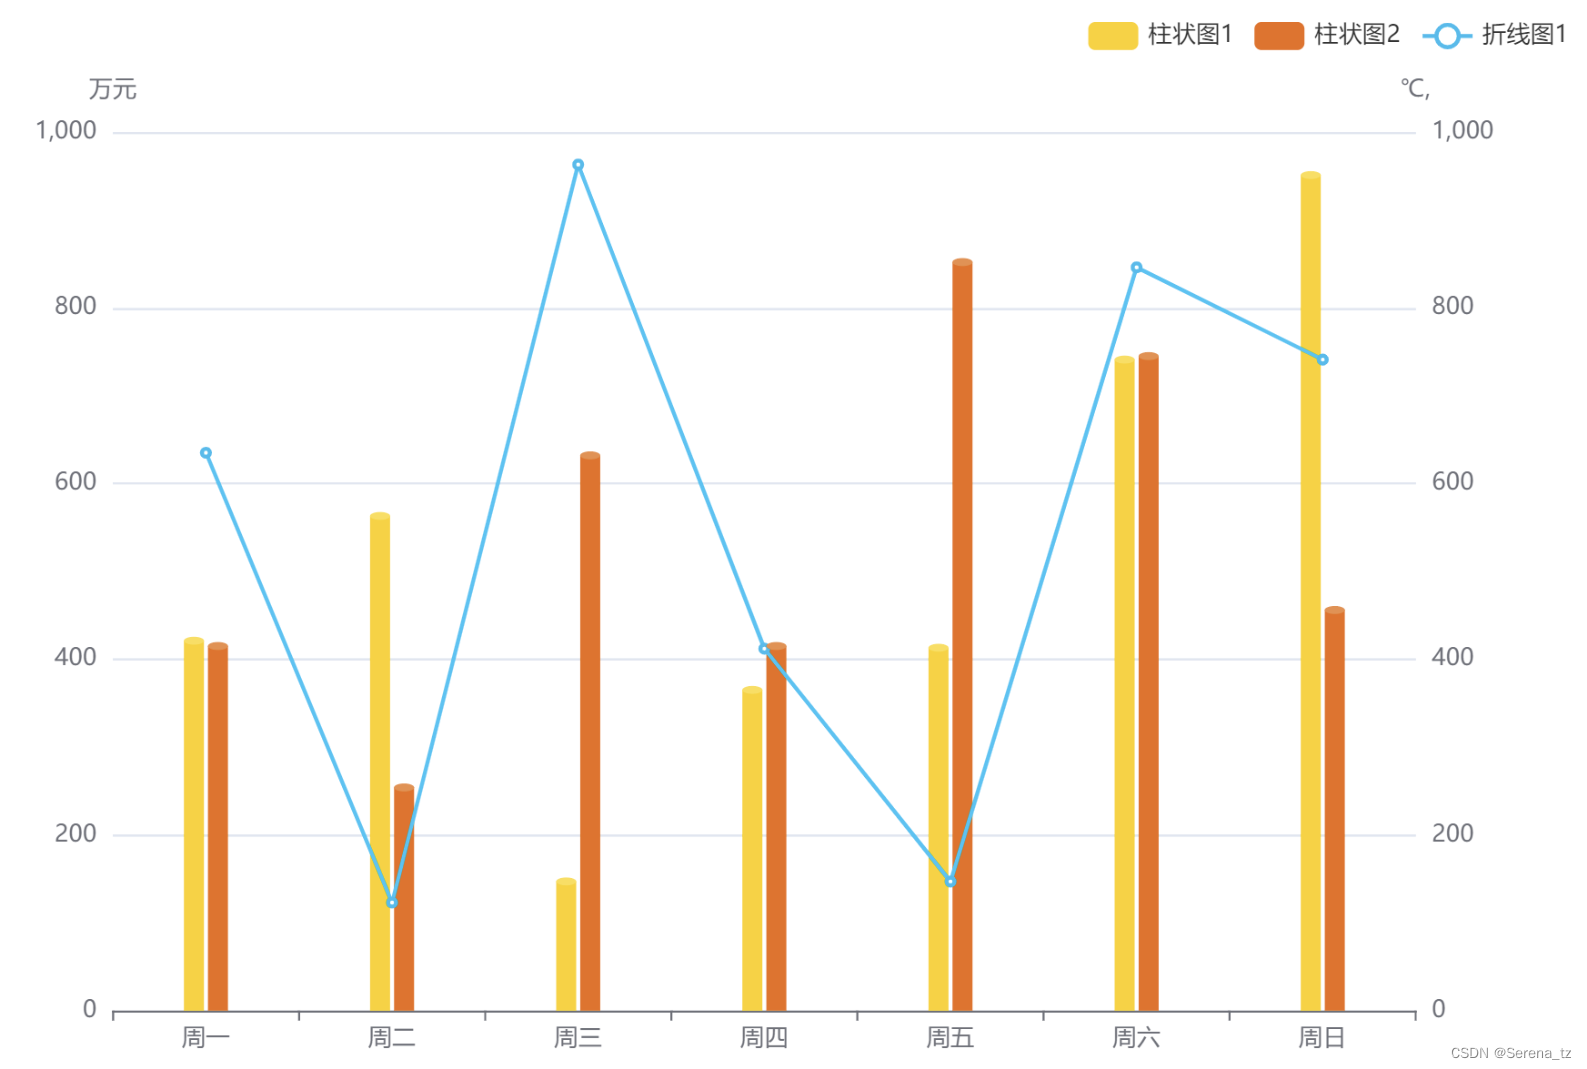
圆柱体折线混合图
效果图:
代码:
const aDataList = [
  { name: '周一', value: 421 },
  { name: '周二', value: 563 },
  { name: '周三', value: 147 },
  { name: '周四', value: 365 },
  { name: '周五', value: 413 },
  { name: '周六', value: 741 },
  { name: '周日', value: 951 }
];

const bDataList = [
  { name: '周一', value: 415 },
  { name: '周二', value: 254 },
  { name: '周三', value: 632 },
  { name: '周四', value: 415 },
  { name: '周五', value: 852 },
  { name: '周六', value: 745 },
  { name: '周日', value: 456 }
];

const cDataList = [
  { name: '周一', value: 635 },
  { name: '周二', value: 123 },
  { name: '周三', value: 963 },
  { name: '周四', value: 412 },
  { name: '周五', value: 147 },
  { name: '周六', value: 846 },
  { name: '周日', value: 741 }
];

const nameArr = ['柱状图1', '柱状图2', '折线图1'];
const unitArr = ['万元', '℃,'];

option = {
  color: ['#FDD000', '#ED6D10', '#20BDEF'],
  legend: {
    data: nameArr,
    left: 'right'
  },
  xAxis: [
    {
      type: 'category',
      data: aDataList.map((item) => item.name)
    }
  ],
  yAxis: [
    {
      type: 'value',
      name: unitArr[0]
    },
    {
      type: 'value',
      name: unitArr[1]
    }
  ],
  series: [
    {
      name: nameArr[0],
      type: 'bar',
      barWidth: 10,
      data: aDataList.map((item) => item.value)
    },
    // 顶部的椭圆形(象形柱图):pictorialBar
    {
      type: 'pictorialBar',
      symbolSize: [10, 4], //图形尺寸
      symbolOffset: [-6, -2], //图形偏移度
      z: 12,
      symbolPosition: 'end',
      itemStyle: {
        color: '#FDDD4C'
      },
      data: aDataList.map((item) => item.value)
    },
    {
      name: nameArr[1],
      type: 'bar',
      barWidth: 10,
      data: bDataList.map((item) => item.value)
    },
    // 顶部的椭圆形(象形柱图):pictorialBar
    {
      type: 'pictorialBar',
      symbolSize: [10, 4], //图形尺寸
      symbolOffset: [6, -2], //图形偏移度
      z: 12,
      symbolPosition: 'end',
      itemStyle: {
        color: '#ED8D47'
      },
      data: bDataList.map((item) => item.value)
    },
    {
      name: nameArr[2],
      type: 'line',
      yAxisIndex: 1,
      data: cDataList.map((item) => item.value)
    }
  ]
};
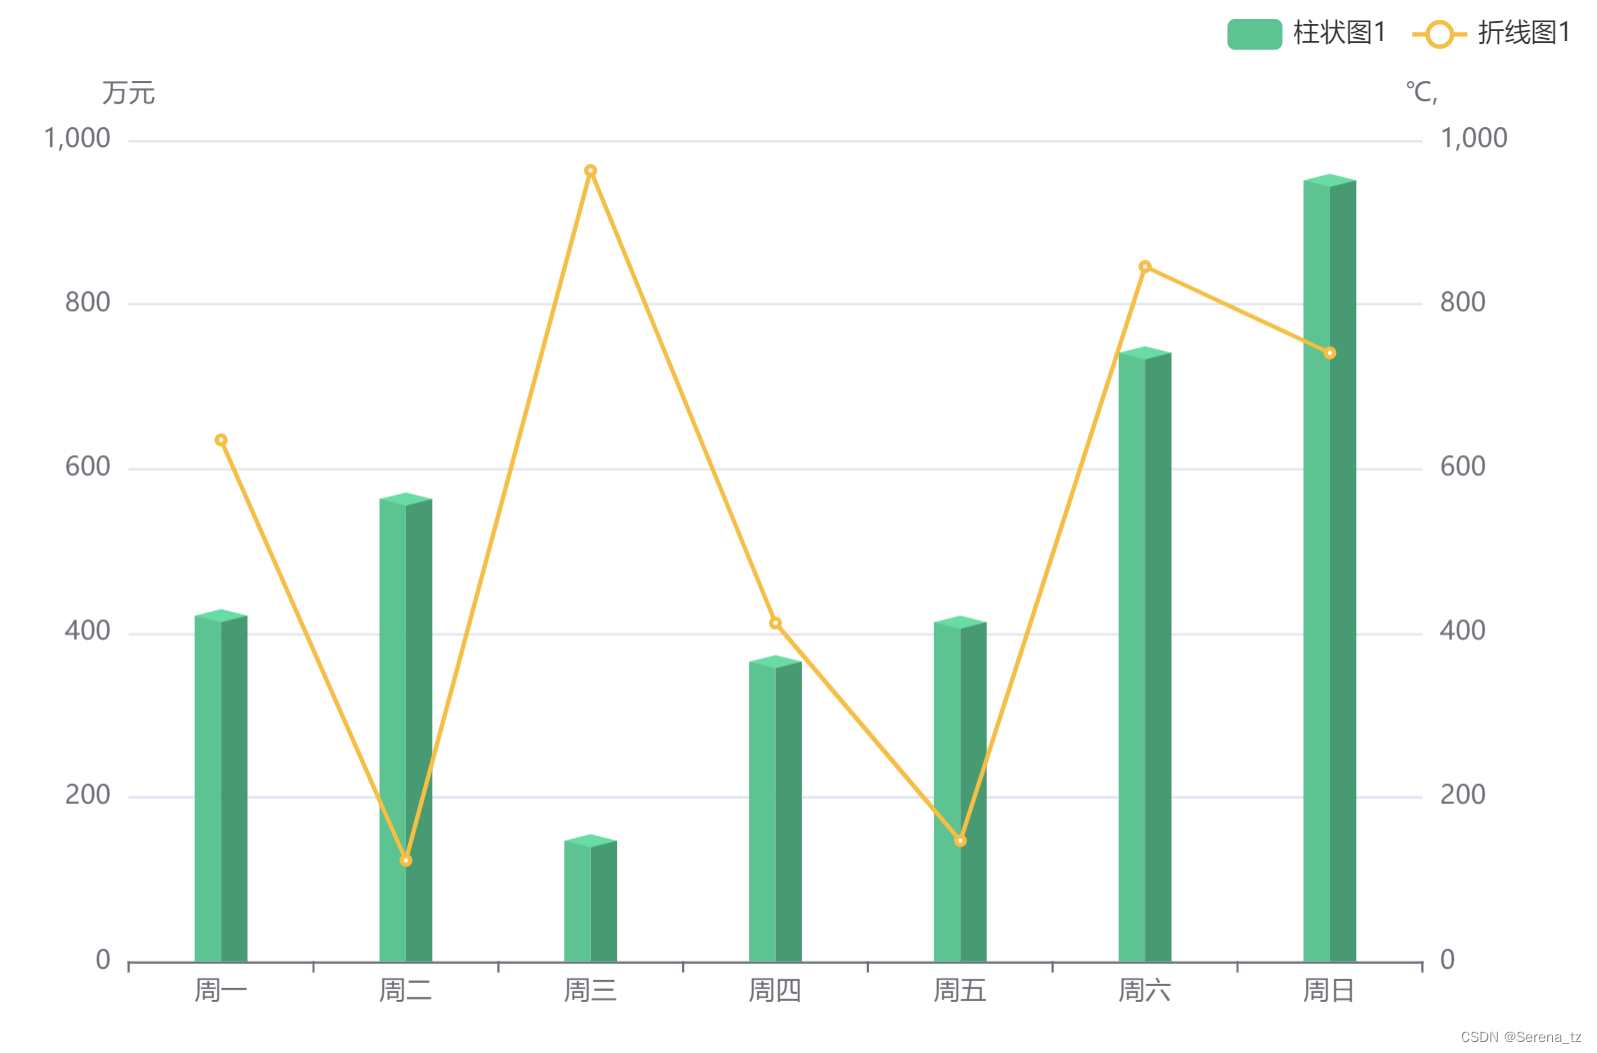
单柱状体折线混合图
效果图:
代码:
const aDataList = [
  { name: '周一', value: 421 },
  { name: '周二', value: 563 },
  { name: '周三', value: 147 },
  { name: '周四', value: 365 },
  { name: '周五', value: 413 },
  { name: '周六', value: 741 },
  { name: '周日', value: 951 }
];

const bDataList = [
  { name: '周一', value: 415 },
  { name: '周二', value: 254 },
  { name: '周三', value: 632 },
  { name: '周四', value: 415 },
  { name: '周五', value: 852 },
  { name: '周六', value: 745 },
  { name: '周日', value: 456 }
];

const cDataList = [
  { name: '周一', value: 635 },
  { name: '周二', value: 123 },
  { name: '周三', value: 963 },
  { name: '周四', value: 412 },
  { name: '周五', value: 147 },
  { name: '周六', value: 846 },
  { name: '周日', value: 741 }
];

const nameArr = ['柱状图1', '柱状图2', '折线图1'];
const unitArr = ['万元', '℃,'];

option = {
  color: ['#31C97C', '#FFBC1B'],
  legend: {
    data: nameArr,
    left: 'right'
  },
  xAxis: [
    {
      type: 'category',
      data: aDataList.map((item) => item.name)
    }
  ],
  yAxis: [
    {
      type: 'value',
      name: unitArr[0]
    },
    {
      type: 'value',
      name: unitArr[1]
    }
  ],
  series: [
    {
      name: nameArr[0],
      type: 'bar',
      barWidth: 12,
      itemStyle: {
        color: '#1CC68E'
      },
      data: aDataList.map((item) => item.value)
    },
    {
      name: nameArr[0],
      type: 'bar',
      barGap: 0,
      barWidth: 12,
      itemStyle: {
        color: '#169C6F'
      },
      data: aDataList.map((item) => item.value)
    },
    {
      // 最上面菱形
      data: aDataList.map((item) => item.value),
      type: 'pictorialBar',
      symbol: 'diamond',
      symbolSize: ['24', '6'],
      symbolPosition: 'end',
      symbolOffset: ['', '-50%'],
      itemStyle: {
        color: '#1FDE9F'
      },
      z: 9
    },
    {
      name: nameArr[2],
      type: 'line',
      yAxisIndex: 1,
      itemStyle: {
        color: '#FFBC1B'
      },
      data: cDataList.map((item) => item.value)
    }
  ]
};
立体柱状图
效果图:

代码:
// 绘制正侧面
var positiveShape = echarts.graphic.extendShape({
  shape: {
    x: 0,
    y: 0
  },
  buildPath: function (ctx, shape) {
    const xAxisPoint = shape.xAxisPoint;
    ctx.moveTo(shape.x + 20, shape.y); //右上
    ctx.lineTo(shape.x - 20, shape.y); //左上
    ctx.lineTo(xAxisPoint[0] - 20, xAxisPoint[1]); //左下
    ctx.lineTo(xAxisPoint[0] + 20, xAxisPoint[1]); //右下
    ctx.closePath();
  }
});

// 绘制右侧面
var rightShape = echarts.graphic.extendShape({
  shape: {
    x: 0,
    y: 0
  },
  buildPath: function (ctx, shape) {
    const xAxisPoint = shape.xAxisPoint;
    ctx.moveTo(shape.x + 25, shape.y - 13); // 右上
    ctx.lineTo(shape.x + 20, shape.y);
    ctx.lineTo(xAxisPoint[0] + 20, xAxisPoint[1]);
    ctx.lineTo(xAxisPoint[0] + 25, xAxisPoint[1] - 13); //右下
    ctx.closePath();
  }
});

// 绘制顶部
var topShape = echarts.graphic.extendShape({
  shape: {
    x: 0,
    y: 0
  },
  buildPath: function (ctx, shape) {
    ctx.moveTo(shape.x + 20, shape.y); //右下
    ctx.lineTo(shape.x + 25, shape.y - 13); //右上
    ctx.lineTo(shape.x - 15, shape.y - 13); //左上
    ctx.lineTo(shape.x - 20, shape.y); //左下
    ctx.closePath();
  }
});

// 注册三个面图形
echarts.graphic.registerShape('positiveShape', positiveShape);
echarts.graphic.registerShape('rightShape', rightShape);
echarts.graphic.registerShape('topShape', topShape);

// 模拟数据
const aDataList = [
  { name: '周一', value: 421 },
  { name: '周二', value: 563 },
  { name: '周三', value: 147 },
  { name: '周四', value: 365 },
  { name: '周五', value: 413 },
  { name: '周六', value: 741 },
  { name: '周日', value: 951 }
];

// 指定图表的配置项和数据
var option = {
  xAxis: {
    type: 'category',
    data: aDataList.map(item => item.name)
  },
  yAxis: {
    //坐标轴轴线相关设置。
    show: 'category',
    type: 'value'
  },
  series: [
    {
      name: '满意率',
      type: 'custom',
      renderItem: function (params, api) {
        const location = api.coord([api.value(0), api.value(1)]);
        return {
          type: 'group',
          children: [
            {
              //正面
              type: 'positiveShape',
              shape: {
                api,
                x: location[0],
                y: location[1],
                xAxisPoint: api.coord([api.value(0), 0])
              },
              style: {
                fill: '#1CC68E'
              }
            },
            {
              type: 'rightShape',
              shape: {
                api,
                x: location[0],
                y: location[1],
                xAxisPoint: api.coord([api.value(0), 0])
              },
              style: {
                fill: '#169C6F'
              }
            },
            {
              //顶部
              type: 'topShape',
              shape: {
                api,
                x: location[0],
                y: location[1],
                xAxisPoint: api.coord([api.value(0), 0])
              },
              style: {
                fill: '#1FDE9F'
              }
            }
          ]
        };
      },
      data:aDataList.map(item => item.value)
    }
  ]
};
双柱状体
效果图:

代码:
const sideData = [220, 182, 191, 234, 290, 330];
const sideData1 = [100, 110, 120, 134, 190, 230];

option = {
  xAxis: [
    {
      type: 'category',
      data: ['三月', '四月', '五月', '六月', '七月', '八月']
    }
  ],
  yAxis: [
    {
      type: 'value'
    }
  ],
  series: [
    {
      name: '去年人数',
      type: 'bar',
      barWidth: 10,
      itemStyle: {
        normal: {
          color: new echarts.graphic.LinearGradient(
            0,
            1,
            0,
            0,
            [
              {
                offset: 0,
                color: 'rgba(255,208,0,0.30)' // 0% 处的颜色
              },
              {
                offset: 1,
                color: '#FF9E00' // 100% 处的颜色
              }
            ],
            false
          )
        }
      },
      data: sideData,
      barGap: 0
    },
    {
      name: '去年人数',
      type: 'bar',
      barWidth: 10,
      itemStyle: {
        normal: {
          color: new echarts.graphic.LinearGradient(
            0,
            1,
            0,
            0,
            [
              {
                offset: 0,
                color: 'rgba(255,208,0,0.30)' // 0% 处的颜色
              },
              {
                offset: 1,
                color: '#FFB000' // 100% 处的颜色
              }
            ],
            false
          )
        }
      },
      barGap: 0,
      data: sideData,
      label: {
        show: true,
        position: 'top',
        textStyle: {
          color: 'white',
          fontSize: 10
        }
      }
    },
    {
      name: '去年人数',
      tooltip: {
        show: false
      },
      type: 'pictorialBar',
      itemStyle: {
        borderWidth: 1,
        borderColor: '#FFC000',
        color: '#FFC000' // 控制顶部方形的颜色
      },
      symbol: 'path://M 0,0 l 90,0 l -60,60 l -90,0 z',
      symbolSize: ['20', '7'], // 第一个值控制顶部方形大小
      symbolOffset: ['-10', '-4'], // 控制顶部放行 左右和上下
      symbolRotate: -16,
      symbolPosition: 'end',
      data: sideData,
      z: 3
    },
    {
      name: '今年人数',
      tooltip: {
        show: false
      },
      type: 'bar',
      barWidth: 10,
      itemStyle: {
        normal: {
          color: new echarts.graphic.LinearGradient(
            0,
            1,
            0,
            0,
            [
              {
                offset: 0,
                color: 'rgba(3,200,195,0.20)' // 100% 处的颜色
              },
              {
                offset: 1,
                color: 'rgba(3,200,195,.5)' // 0% 处的颜色
              }
            ],
            false
          )
        }
      },
      data: sideData1,
      barGap: 0
    },
    {
      name: '今年人数',
      type: 'bar',
      barWidth: 10,
      itemStyle: {
        normal: {
          color: new echarts.graphic.LinearGradient(
            0,
            1,
            0,
            0,
            [
              {
                offset: 0,
                color: 'rgba(3,200,195,0.20) ' // 0% 处的颜色
              },
              {
                offset: 1,
                color: 'rgba(3,200,195,.9)' // 100% 处的颜色
              }
            ],
            false
          )
        }
      },
      barGap: 0,
      data: sideData1,
      label: {
        show: true,
        position: 'top',
        textStyle: {
          color: 'white',
          fontSize: 10
        }
      }
    },
    {
      name: '今年人数',
      tooltip: {
        show: false
      },
      type: 'pictorialBar',
      itemStyle: {
        borderWidth: 1,
        borderColor: '#03C8C3',
        color: '#03C8C3' // 顶部方块的颜色
      },
      symbol: 'path://M 0,0 l 90,0 l -60,60 l -90,0 z',
      symbolSize: ['20', '7'], // 第一个值控制顶部方形大小
      symbolOffset: ['10', '-4'], // 控制顶部放行 左右和上下
      symbolRotate: -16,
      symbolPosition: 'end',
      data: sideData1,
      z: 3
    }
  ]
};
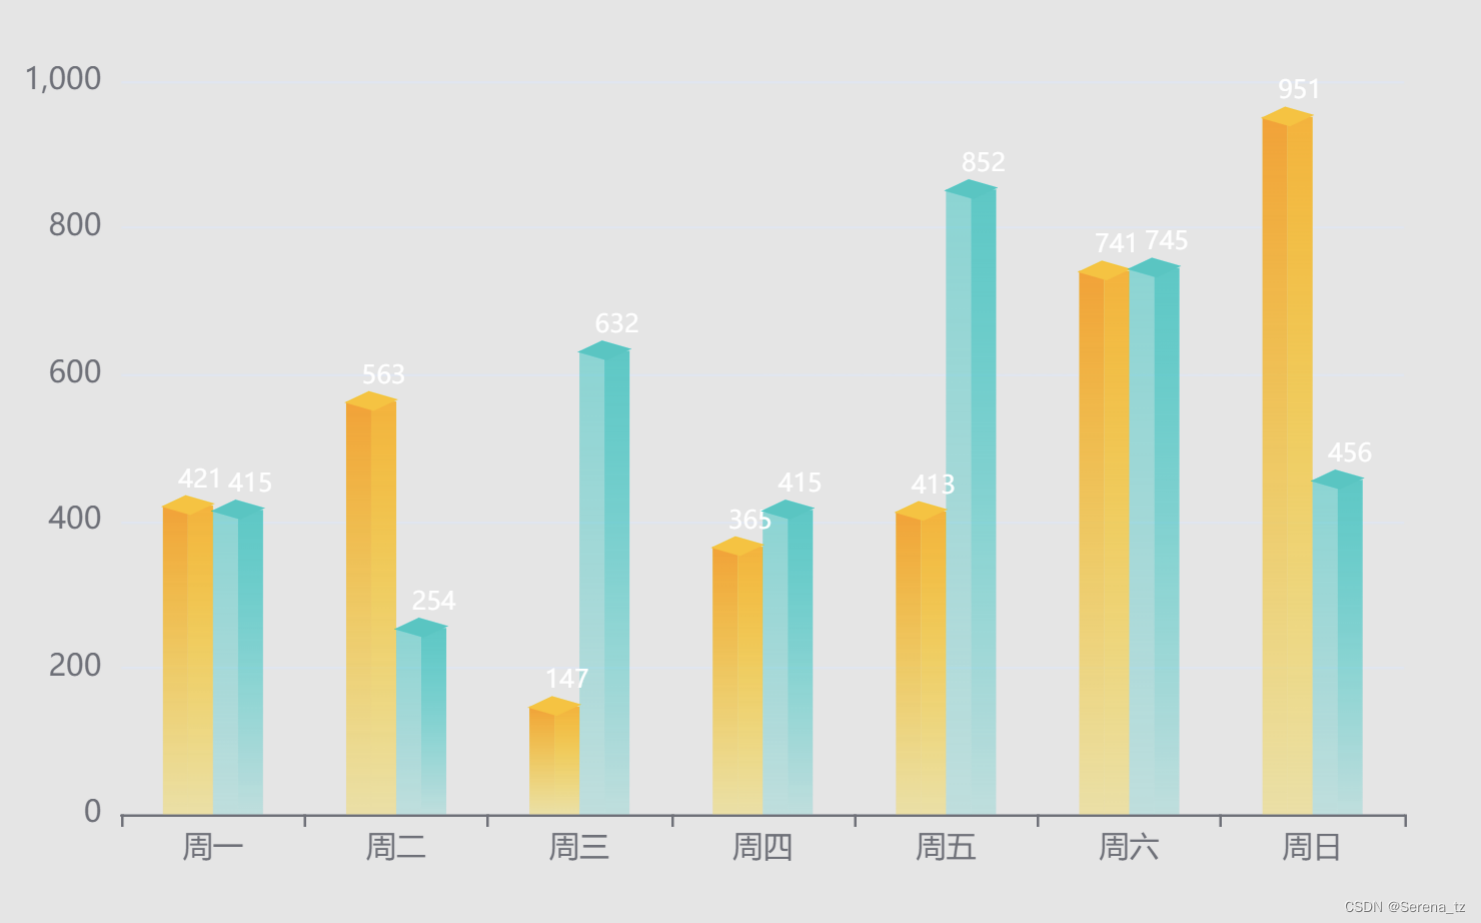
双立体柱状图带背景色+数据label
效果图:
代码:
// 模拟数据
const aDataList = [
  { name: '周一', value: 421 },
  { name: '周二', value: 563 },
  { name: '周三', value: 147 },
  { name: '周四', value: 365 },
  { name: '周五', value: 413 },
  { name: '周六', value: 741 },
  { name: '周日', value: 951 }
];

const bDataList = [
  { name: '周一', value: 415 },
  { name: '周二', value: 254 },
  { name: '周三', value: 632 },
  { name: '周四', value: 415 },
  { name: '周五', value: 852 },
  { name: '周六', value: 745 },
  { name: '周日', value: 456 }
];

option = {
  backgroundColor:"#e5e5e5",
  xAxis: [
    {
      type: 'category',
      data: aDataList.map((item) => item.name)
    }
  ],
  yAxis: [
    {
      type: 'value'
    }
  ],
  series: [
    {
      name: '去年人数',
      type: 'bar',
      barWidth: 10,
      itemStyle: {
        normal: {
          color: new echarts.graphic.LinearGradient(
            0,
            1,
            0,
            0,
            [
              {
                offset: 0,
                color: 'rgba(255,208,0,0.30)' // 0% 处的颜色
              },
              {
                offset: 1,
                color: '#FF9E00' // 100% 处的颜色
              }
            ],
            false
          )
        }
      },
      data: aDataList.map((item) => item.value),
      barGap: 0
    },
    {
      name: '去年人数',
      type: 'bar',
      barWidth: 10,
      itemStyle: {
        normal: {
          color: new echarts.graphic.LinearGradient(
            0,
            1,
            0,
            0,
            [
              {
                offset: 0,
                color: 'rgba(255,208,0,0.30)' // 0% 处的颜色
              },
              {
                offset: 1,
                color: '#FFB000' // 100% 处的颜色
              }
            ],
            false
          )
        }
      },
      barGap: 0,
      data: aDataList.map((item) => item.value),
      label: {
        show: true,
        position: 'top',
        textStyle: {
          color: 'white',
          fontSize: 10
        }
      }
    },
    {
      name: '去年人数',
      tooltip: {
        show: false
      },
      type: 'pictorialBar',
      itemStyle: {
        borderWidth: 1,
        borderColor: '#FFC000',
        color: '#FFC000' // 控制顶部方形的颜色
      },
      symbol: 'path://M 0,0 l 90,0 l -60,60 l -90,0 z',
      symbolSize: ['20', '7'], // 第一个值控制顶部方形大小
      symbolOffset: ['-10', '-4'], // 控制顶部放行 左右和上下
      symbolRotate: -16,
      symbolPosition: 'end',
      data: aDataList.map((item) => item.value),
      z: 3
    },
    {
      name: '今年人数',
      tooltip: {
        show: false
      },
      type: 'bar',
      barWidth: 10,
      itemStyle: {
        normal: {
          color: new echarts.graphic.LinearGradient(
            0,
            1,
            0,
            0,
            [
              {
                offset: 0,
                color: 'rgba(3,200,195,0.20)' // 100% 处的颜色
              },
              {
                offset: 1,
                color: 'rgba(3,200,195,.5)' // 0% 处的颜色
              }
            ],
            false
          )
        }
      },
      data: bDataList.map((item) => item.value),
      barGap: 0
    },
    {
      name: '今年人数',
      type: 'bar',
      barWidth: 10,
      itemStyle: {
        normal: {
          color: new echarts.graphic.LinearGradient(
            0,
            1,
            0,
            0,
            [
              {
                offset: 0,
                color: 'rgba(3,200,195,0.20) ' // 0% 处的颜色
              },
              {
                offset: 1,
                color: 'rgba(3,200,195,.9)' // 100% 处的颜色
              }
            ],
            false
          )
        }
      },
      barGap: 0,
      data: bDataList.map((item) => item.value),
      label: {
        show: true,
        position: 'top',
        textStyle: {
          color: 'white',
          fontSize: 10
        }
      }
    },
    {
      name: '今年人数',
      tooltip: {
        show: false
      },
      type: 'pictorialBar',
      itemStyle: {
        borderWidth: 1,
        borderColor: '#03C8C3',
        color: '#03C8C3' // 顶部方块的颜色
      },
      symbol: 'path://M 0,0 l 90,0 l -60,60 l -90,0 z',
      symbolSize: ['20', '7'], // 第一个值控制顶部方形大小
      symbolOffset: ['10', '-4'], // 控制顶部放行 左右和上下
      symbolRotate: -16,
      symbolPosition: 'end',
      data: bDataList.map((item) => item.value),
      z: 3
    }
  ]
};
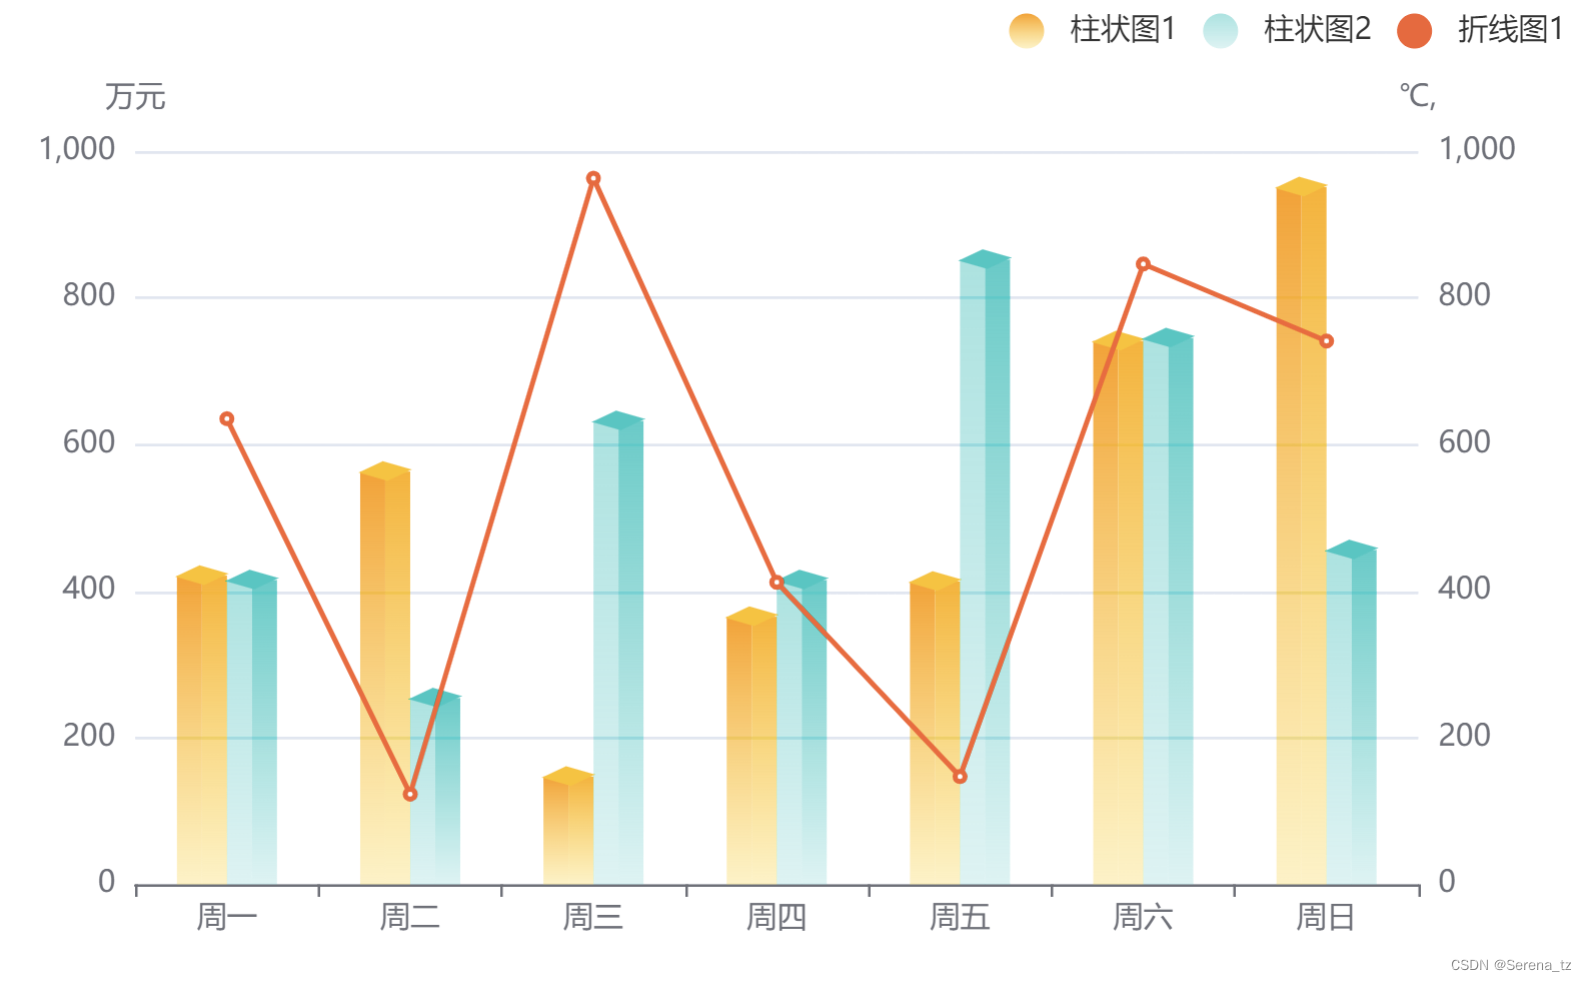
双立体柱状图折线混合图
效果图:
代码:
// 模拟数据
const aDataList = [
  { name: '周一', value: 421 },
  { name: '周二', value: 563 },
  { name: '周三', value: 147 },
  { name: '周四', value: 365 },
  { name: '周五', value: 413 },
  { name: '周六', value: 741 },
  { name: '周日', value: 951 }
];

const bDataList = [
  { name: '周一', value: 415 },
  { name: '周二', value: 254 },
  { name: '周三', value: 632 },
  { name: '周四', value: 415 },
  { name: '周五', value: 852 },
  { name: '周六', value: 745 },
  { name: '周日', value: 456 }
];

const cDataList = [
  { name: '周一', value: 635 },
  { name: '周二', value: 123 },
  { name: '周三', value: 963 },
  { name: '周四', value: 412 },
  { name: '周五', value: 147 },
  { name: '周六', value: 846 },
  { name: '周日', value: 741 }
];

const nameArr = ['柱状图1', '柱状图2', '折线图1'];
const unitArr = ['万元', '℃,'];

option = {
  legend: {
    data: nameArr,
    left: 'right',
    icon: 'circle'
  },
  xAxis: [
    {
      type: 'category',
      data: aDataList.map((item) => item.name)
    }
  ],
  yAxis: [
    {
      type: 'value',
      name: unitArr[0]
    },
    {
      type: 'value',
      name: unitArr[1]
    }
  ],
  series: [
    {
      name: nameArr[0],
      type: 'bar',
      barWidth: 10,
      itemStyle: {
        normal: {
          color: new echarts.graphic.LinearGradient(
            0,
            1,
            0,
            0,
            [
              {
                offset: 0,
                color: 'rgba(255,208,0,0.30)' // 0% 处的颜色
              },
              {
                offset: 1,
                color: '#FF9E00' // 100% 处的颜色
              }
            ],
            false
          )
        }
      },
      data: aDataList.map((item) => item.value),
      barGap: 0
    },
    {
      name: nameArr[0],
      type: 'bar',
      barWidth: 10,
      itemStyle: {
        normal: {
          color: new echarts.graphic.LinearGradient(
            0,
            1,
            0,
            0,
            [
              {
                offset: 0,
                color: 'rgba(255,208,0,0.30)' // 0% 处的颜色
              },
              {
                offset: 1,
                color: '#FFB000' // 100% 处的颜色
              }
            ],
            false
          )
        }
      },
      barGap: 0,
      data: aDataList.map((item) => item.value)
    },
    {
      name: nameArr[0],
      tooltip: {
        show: false
      },
      type: 'pictorialBar',
      itemStyle: {
        borderWidth: 1,
        borderColor: '#FFC000',
        color: '#FFC000' // 控制顶部方形的颜色
      },
      symbol: 'path://M 0,0 l 90,0 l -60,60 l -90,0 z',
      symbolSize: ['20', '7'], // 第一个值控制顶部方形大小
      symbolOffset: ['-10', '-4'], // 控制顶部放行 左右和上下
      symbolRotate: -16,
      symbolPosition: 'end',
      data: aDataList.map((item) => item.value),
      z: 3
    },
    {
      name: nameArr[1],
      tooltip: {
        show: false
      },
      type: 'bar',
      barWidth: 10,
      itemStyle: {
        normal: {
          color: new echarts.graphic.LinearGradient(
            0,
            1,
            0,
            0,
            [
              {
                offset: 0,
                color: 'rgba(3,200,195,0.20)' // 100% 处的颜色
              },
              {
                offset: 1,
                color: 'rgba(3,200,195,.5)' // 0% 处的颜色
              }
            ],
            false
          )
        }
      },
      data: bDataList.map((item) => item.value),
      barGap: 0
    },
    {
      name: nameArr[1],
      type: 'bar',
      barWidth: 10,
      itemStyle: {
        normal: {
          color: new echarts.graphic.LinearGradient(
            0,
            1,
            0,
            0,
            [
              {
                offset: 0,
                color: 'rgba(3,200,195,0.20) ' // 0% 处的颜色
              },
              {
                offset: 1,
                color: 'rgba(3,200,195,.9)' // 100% 处的颜色
              }
            ],
            false
          )
        }
      },
      barGap: 0,
      data: bDataList.map((item) => item.value),
      label: {
        show: true,
        position: 'top',
        textStyle: {
          color: 'white',
          fontSize: 10
        }
      }
    },
    {
      name: nameArr[1],
      tooltip: {
        show: false
      },
      type: 'pictorialBar',
      itemStyle: {
        borderWidth: 1,
        borderColor: '#03C8C3',
        color: '#03C8C3' // 顶部方块的颜色
      },
      symbol: 'path://M 0,0 l 90,0 l -60,60 l -90,0 z',
      symbolSize: ['20', '7'], // 第一个值控制顶部方形大小
      symbolOffset: ['10', '-4'], // 控制顶部放行 左右和上下
      symbolRotate: -16,
      symbolPosition: 'end',
      data: bDataList.map((item) => item.value),
      z: 3
    },
    {
      name: nameArr[2],
      type: 'line',
      yAxisIndex: 1,
      itemStyle: {
        color: '#F76030'
      },
      data: cDataList.map((item) => item.value)
    }
  ]
};
双立体柱状图
效果图:

代码:
//组织数据
let setData = function (data, constData, showData) {
  data.filter(function (item) {
    if (item) {
      constData.push(1);
      showData.push(item);
    } else {
      constData.push(0);
      showData.push({
        value: 1,
        itemStyle: {
          normal: {
            borderColor: 'rgba(0,0,0,0)',
            borderWidth: 2,
            color: 'rgba(0,0,0,0)'
          }
        }
      });
    }
  });
};

//组织颜色
let setColor = function (colorArr) {
  let color = {
    type: 'linear',
    x: 0,
    x2: 1,
    y: 0,
    y2: 0,
    /* 此处决定阴暗面 若为横向柱状图则x,y轴调换
					x: 0,
					x2: 0,
					y: 0,
					y2: 1, */
    colorStops: [
      {
        offset: 0,
        color: colorArr[0]
      },
      {
        offset: 0.5,
        color: colorArr[0]
      },
      {
        offset: 0.5,
        color: colorArr[1]
      },
      {
        offset: 1,
        color: colorArr[1]
      }
    ]
  };
  return color;
};

var vehicle = [45, 25, 48, 62, 35];
var controlBall = [23, 12, 52, 14, 9];

var barWidth = 30;
var constData1 = [];
var showData1 = [];

var constData2 = [];
var showData2 = [];

setData(vehicle, constData1, showData1);
setData(controlBall, constData2, showData2);

var colorArr1 = ['#345A8B', '#387ABD', '#51C0DB'];
var colorArr2 = ['#51C0DB', '#42D9D6', '#45F5F1'];

var color1 = setColor(colorArr1);
var color2 = setColor(colorArr2);

var option = {
  xAxis: {
    type: 'category',
    data: ['合肥', '安庆', '芜湖', '南京', '杭州']
  },
  yAxis: {
    type: 'value'
  },
  series: [
    {
      z: 1,
      type: 'bar',
      name: '柱子1',
      barGap: '15%', //相邻柱子间距
      itemStyle: {
        borderRadius: [0, 0, 0, 0], //柱子四周圆角
        color: color1 //柱子左右颜色(深,浅)
      },
      data: vehicle //Y轴上的高度
    },
    {
      z: 3,
      name: '柱子1',
      type: 'pictorialBar',
      symbolPosition: 'end',
      data: showData1, //此数据对应顶部组件
      symbol: 'diamond',
      symbolOffset: ['-55%', '-50%'],
      symbolSize: [barWidth, (10 * (barWidth - 4)) / barWidth],
      itemStyle: {
        normal: {
          color: colorArr1[2]
        }
      },
      tooltip: {
        show: false
      }
    },
    {
      z: 1,
      type: 'bar',
      name: '柱子2',
      itemStyle: {
        borderRadius: [0, 0, 0, 0],
        color: color2
      },
      data: controlBall
    },
    {
      z: 3,
      name: '柱子2',
      type: 'pictorialBar',
      symbolPosition: 'end',
      data: showData2,
      symbol: 'diamond',
      symbolOffset: ['58%', '-50%'],
      symbolSize: [barWidth, (10 * (barWidth - 4)) / barWidth],
      itemStyle: {
        normal: {
          color: colorArr2[2]
        }
      },
      tooltip: {
        show: false
      }
    }
  ]
};
3D立体饼图
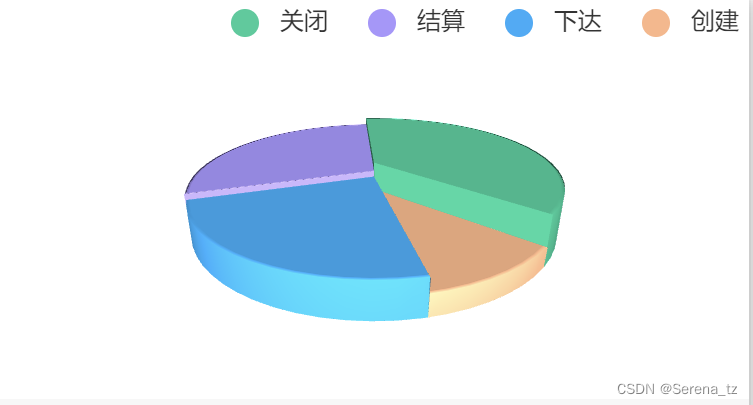
在vue项目中安装echarts、echarts-gl插件,命令如下:
npm i echarts
npm i echarts-gl
代码:
<template>
	<view class="container">
		<div style="width:100%;height:200px">
			<div ref="basicDataPie" style="width:100%;height:100%"></div>
		</div>
	</view>
</template>
<script>
	import * as echarts from "echarts";
	import "echarts-gl";
	export default {
		data() {
			return {
				data: [{
						name: "创建",
						value: 16,
						itemStyle: {
							color: "#FEB587"
						}
					},
					{
						name: "下达",
						value: 35,
						itemStyle: {
							color: "#21ADF9"
						}
					},
					{
						name: "结算",
						value: 44,
						itemStyle: {
							color: "#A896FE"
						}
					},
					{
						name: "关闭",
						value: 56,
						itemStyle: {
							color: "#1FCC9A"
						}
					}
				],
			};
		},
		onReady() {
			this.echartsPie();
		},
		methods: {
			echartsPie() {
				let hoveredIndex = "";
				let chartDom = this.$refs["basicDataPie"];
				let myChart = echarts.init(chartDom);

				const getPie3D = (pieData, internalDiameterRatio) => {
					//internalDiameterRatio:透明的空心占比
					let series = [];
					let sumValue = 0;
					let startValue = 0;
					let endValue = 0;
					let k = 1;
					pieData.sort((a, b) => {
						return b.value - a.value;
					});
					// 为每一个饼图数据,生成一个 series-surface 配置
					for (let i = 0; i < pieData.length; i++) {
						sumValue += pieData[i].value;
						let seriesItem = {
							name: typeof pieData[i].name === "undefined" ?
								`series${i}` : pieData[i].name,
							type: "surface",
							parametric: true,
							wireframe: {
								show: false,
							},
							pieData: pieData[i],
							pieStatus: {
								selected: false,
								hovered: false,
								k: k,
							},
							radius: "50%",
							center: ["10%", "10%"],
						};

						if (typeof pieData[i].itemStyle != "undefined") {
							let itemStyle = {};
							typeof pieData[i].itemStyle.color != "undefined" ?
								(itemStyle.color = pieData[i].itemStyle.color) :
								null;
							typeof pieData[i].itemStyle.opacity != "undefined" ?
								(itemStyle.opacity = pieData[i].itemStyle.opacity) :
								null;
							seriesItem.itemStyle = itemStyle;
						}
						series.push(seriesItem);
					}

					// 使用上一次遍历时,计算出的数据和 sumValue,调用 getParametricEquation 函数,
					// 向每个 series-surface 传入不同的参数方程 series-surface.parametricEquation,也就是实现每一个扇形。
					for (let i = 0; i < series.length; i++) {
						endValue = startValue + series[i].pieData.value;
						series[i].pieData.startRatio = startValue / sumValue;
						series[i].pieData.endRatio = endValue / sumValue;
						series[i].parametricEquation = getParametricEquation(
							series[i].pieData.startRatio,
							series[i].pieData.endRatio,
							false,
							false,
							k,
							series[i].pieData.value
						);
						startValue = endValue;
					}
					let boxHeight = getHeight3D(series, 30); //通过传参设定3d饼/环的高度,26代表26px
					// 准备待返回的配置项,把准备好的 legendData、series 传入。
					let option = {
						backgroundColor: "#fff",
						tooltip: {
							backgroundColor: "#fff",
							formatter: (params) => {
								if (
									params.seriesName !== "mouseoutSeries" &&
									params.seriesName !== "pie3d"
								) {
									let bfb = (
										(option.series[params.seriesIndex].pieData.endRatio -
											option.series[params.seriesIndex].pieData.startRatio) *
										100
									).toFixed(2);
									return (
										`${params.seriesName}<br/>` +
										`<span style="display:inline-block;margin-right:5px;border-radius:10px;width:10px;height:10px;background-color:${params.color};"></span>` +
										`${bfb}%`
									);
								}
							},
						},
						legend: {
							left: "right",
							itemGap: 20,
							icon: "circle",
						},
						xAxis3D: {
							min: -1,
							max: 1,
						},
						yAxis3D: {
							min: -1,
							max: 1,
						},
						zAxis3D: {
							min: -1,
							max: 1,
						},
						grid3D: {
							show: false,
							boxHeight: boxHeight, //圆环的高度
							left: 0,
							top: 0, //3d饼图的位置
							viewControl: {
								//3d效果可以放大、旋转等,请自己去查看官方配置
								alpha: 25, //角度
								distance: 250, //调整视角到主体的距离,类似调整zoom
								rotateSensitivity: 0, //设置为0无法旋转
								zoomSensitivity: 0, //设置为0无法缩放
								panSensitivity: 0, //设置为0无法平移
								autoRotate: false, //自动旋转
							},
						},
						series: series,
					};
					return option;
				};

				//获取3d丙图的最高扇区的高度
				const getHeight3D = (series, height) => {
					series.sort((a, b) => {
						return b.pieData.value - a.pieData.value;
					});
					return (height * 15) / series[0].pieData.value;
				};

				// 生成扇形的曲面参数方程,用于 series-surface.parametricEquation
				const getParametricEquation = (
					startRatio,
					endRatio,
					isSelected,
					isHovered,
					k,
					h
				) => {
					// 计算
					let midRatio = (startRatio + endRatio) / 2;
					let startRadian = startRatio * Math.PI * 2;
					let endRadian = endRatio * Math.PI * 2;
					let midRadian = midRatio * Math.PI * 2;
					// 如果只有一个扇形,则不实现选中效果。
					if (startRatio === 0 && endRatio === 1) {
						isSelected = false;
					}
					// 通过扇形内径/外径的值,换算出辅助参数 k(默认值 1/3)
					k = typeof k !== "undefined" ? k : 1 / 3;
					// 计算选中效果分别在 x 轴、y 轴方向上的位移(未选中,则位移均为 0)
					let offsetX = isSelected ? Math.cos(midRadian) * 0.1 : 0;
					let offsetY = isSelected ? Math.sin(midRadian) * 0.1 : 0;
					// 计算高亮效果的放大比例(未高亮,则比例为 1)
					let hoverRate = isHovered ? 1.05 : 1;
					// 返回曲面参数方程
					return {
						u: {
							min: -Math.PI,
							max: Math.PI * 3,
							step: Math.PI / 32,
						},
						v: {
							min: 0,
							max: Math.PI * 2,
							step: Math.PI / 20,
						},
						x: function(u, v) {
							if (u < startRadian) {
								return (
									offsetX +
									Math.cos(startRadian) * (1 + Math.cos(v) * k) * hoverRate
								);
							}
							if (u > endRadian) {
								return (
									offsetX +
									Math.cos(endRadian) * (1 + Math.cos(v) * k) * hoverRate
								);
							}
							return offsetX + Math.cos(u) * (1 + Math.cos(v) * k) * hoverRate;
						},
						y: function(u, v) {
							if (u < startRadian) {
								return (
									offsetY +
									Math.sin(startRadian) * (1 + Math.cos(v) * k) * hoverRate
								);
							}
							if (u > endRadian) {
								return (
									offsetY +
									Math.sin(endRadian) * (1 + Math.cos(v) * k) * hoverRate
								);
							}
							return offsetY + Math.sin(u) * (1 + Math.cos(v) * k) * hoverRate;
						},
						z: function(u, v) {
							if (u < -Math.PI * 0.5) {
								return Math.sin(u);
							}
							if (u > Math.PI * 2.5) {
								return Math.sin(u) * h * 0.1;
							}
							return Math.sin(v) > 0 ? 1 * h * 0.1 : -1;
						},
					};
				};

				let option = getPie3D(this.data, 0.8);
				//是否需要label指引线,如果要就添加一个透明的2d饼状图并调整角度使得labelLine和3d的饼状图对齐,并再次setOption
				option.series.push({
					// name: "pie3d",
					type: "pie",
					label: {
						show: false,
						position: "inside",
						formatter: "{c}%",
					},
					// startAngle: -25, //起始角度,支持范围[0, 360]。
					clockwise: false, //饼图的扇区是否是顺时针排布。上述这两项配置主要是为了对齐3d的样式
					radius: ["65%", "65%"],
					center: ["55%", "48%"], //指示线的位置
					itemStyle: {
						opacity: 0,
					},
				});
				option && myChart.setOption(option);

				myChart.on("mouseover", function(params) {
					// 准备重新渲染扇形所需的参数
					let isSelected;
					let isHovered;
					let startRatio;
					let endRatio;
					let k;
					let i;

					// 如果触发 mouseover 的扇形当前已高亮,则不做操作
					if (hoveredIndex === params.seriesIndex) {
						return;

						// 否则进行高亮及必要的取消高亮操作
					} else {
						// 如果当前有高亮的扇形,取消其高亮状态(对 option 更新)
						if (hoveredIndex !== "") {
							// 从 option.series 中读取重新渲染扇形所需的参数,将是否高亮设置为 false。
							isSelected = option.series[hoveredIndex].pieStatus.selected;
							isHovered = false;
							startRatio = option.series[hoveredIndex].pieData.startRatio;
							endRatio = option.series[hoveredIndex].pieData.endRatio;
							k = option.series[hoveredIndex].pieStatus.k;
							i =
								option.series[hoveredIndex].pieData.value ===
								option.series[0].pieData.value ?
								35 :
								10;
							// 对当前点击的扇形,执行取消高亮操作(对 option 更新)
							option.series[hoveredIndex].parametricEquation =
								getParametricEquation(
									startRatio,
									endRatio,
									isSelected,
									isHovered,
									k,
									i
								);
							option.series[hoveredIndex].pieStatus.hovered = isHovered;

							// 将此前记录的上次选中的扇形对应的系列号 seriesIndex 清空
							hoveredIndex = "";
						}

						// 如果触发 mouseover 的扇形不是透明圆环,将其高亮(对 option 更新)
						if (
							params.seriesName !== "mouseoutSeries" &&
							option.series[params.seriesIndex].pieStatus
						) {
							// 从 option.series 中读取重新渲染扇形所需的参数,将是否高亮设置为 true。
							isSelected = option.series[params.seriesIndex].pieStatus.selected;
							isHovered = true;
							startRatio = option.series[params.seriesIndex].pieData.startRatio;
							endRatio = option.series[params.seriesIndex].pieData.endRatio;
							k = option.series[params.seriesIndex].pieStatus.k;

							// 对当前点击的扇形,执行高亮操作(对 option 更新)
							option.series[params.seriesIndex].parametricEquation =
								getParametricEquation(
									startRatio,
									endRatio,
									isSelected,
									isHovered,
									k,
									option.series[params.seriesIndex].pieData.value + 5
								);
							option.series[params.seriesIndex].pieStatus.hovered = isHovered;

							// 记录上次高亮的扇形对应的系列号 seriesIndex
							hoveredIndex = params.seriesIndex;
						}

						// 使用更新后的 option,渲染图表
						myChart.setOption(option);
					}
				});
			},
		},
	};
</script>
参考文章
- echarts 立体图
- 记录下echarts立体柱形图实现的几种方式
- echarts-3D立体饼图(1)
- echarts 实现圆柱体柱形图效果
- 【ECharts】环形图、饼状图
- echarts面积图颜色渐变的实现
- echarts怎么设置双纵坐标并且可以缩放,自适应浏览器
- echarts-3D立体饼图(2)
- echarts3d饼图,环形图(包含透明效果)
- echarts 实现3D饼图
- Echarts 3D饼图开发
- echarts下载、使用
- echarts 实现圆柱体柱形图效果
- echarts 双立体柱状图
- echarts - 自定义形状 - 实现立体柱状图
- ECharts实现立体柱形图
- echarts实现3D柱状图(视觉层面)和3D饼图